NetFlix 2012 Annual Report Download - page 38
Download and view the complete annual report
Please find page 38 of the 2012 NetFlix annual report below. You can navigate through the pages in the report by either clicking on the pages listed below, or by using the keyword search tool below to find specific information within the annual report.-
 1
1 -
2
-
3
-
4
-
5
-
6
-
7
-
8
-
9
-
10
-
11
-
12
-
13
-
14
-
15
-
16
-
17
-
18
-
19
-
20
-
21
-
22
-
23
-
24
-
25
-
26
-
27
-
 28
28 -
 29
29 -
 30
30 -
 31
31 -
 32
32 -
 33
33 -
 34
34 -
 35
35 -
 36
36 -
 37
37 -
 38
38 -
 39
39 -
 40
40 -
 41
41 -
 42
42 -
 43
43 -
 44
44 -
 45
45 -
 46
46 -
 47
47 -
 48
48 -
49
-
50
-
51
-
52
-
53
-
54
-
55
-
56
-
57
-
58
-
59
-
60
-
61
-
62
-
63
-
64
-
65
-
66
-
67
-
68
-
69
-
70
-
71
-
72
-
73
-
74
-
75
-
76
-
77
-
78
-
79
-
80
-
81
-
82
-
83
-
84
-
85
-
86
-
87
-
88
 |
 |

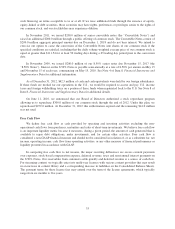
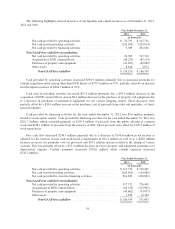
The following highlights selected measures of our liquidity and capital resources as of December 31, 2012,
2011 and 2010:
Year Ended December 31,
2012 2011
(in thousands)
Net cash provided by operating activities ....................... $ 22,765 $ 317,712
Net cash used in investing activities ............................ (245,919) (265,814)
Net cash provided by financing activities ....................... 5,589 261,656
Non-GAAP free cash flow reconciliation:
Net cash provided by operating activities ....................... 22,765 317,712
Acquisition of DVD content library ............................ (48,275) (85,154)
Purchases of property and equipment ........................... (41,457) (49,682)
Other assets ............................................... 8,816 3,674
Non-GAAP free cash flow .............................. $ (58,151) $ 186,550
Cash provided by operating activities decreased $294.9 million, primarily due to increased payments for
content acquisition and licensing other than DVD library of $779.5 million or 59%, partially offset by an increase
in subscription revenues of $404.7 million or 13%.
Cash used in investing activities decreased $19.9 million primarily due a $36.9 million decrease in the
acquisition of DVD content library and an $8.2 million decrease in the purchase of property and equipment due
to a decrease in purchases of automation equipment for our various shipping centers. These decreases were
partially offset by a $30.4 million increase in the purchases, net of proceeds from sales and maturities, of short-
term investments.
Cash provided by financing activities for the year ended December 31, 2012 was $5.6 million primarily
related to stock option activity. Cash provided by financing activities for the year ended December 31, 2011 was
$261.7 million, which consisted primarily of $199.9 million of proceeds from the public offering of common
stock and $198.1 million of proceeds from the issuance of debt. These proceeds were offset by $199.7 million of
stock repurchases.
Free cash flow decreased $244.7 million primarily due to a decrease of $196.6 million in net income as
adjusted for the increase in non-cash stock-based compensation of $12.4 million as well as to a $28.6 million
increase in excess tax payments over tax provision and $34.1 million increase related to the timing of various
accruals. This was partially offset by a $13.0 million decrease in excess property and equipment payments over
depreciation expense. Content payments increased $742.6 million while content expenses increased
$745.2 million.
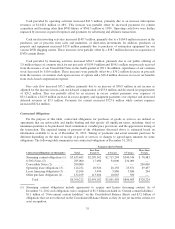
Year Ended December 31,
2011 2010
(in thousands)
Net cash provided by operating activities ....................... $317,712 $ 276,401
Net cash used in investing activities ............................ (265,814) (116,081)
Net cash provided by (used in) financing activities ................ 261,656 (100,045)
Non-GAAP free cash flow reconciliation:
Net cash provided by operating activities ....................... 317,712 276,401
Acquisitions of DVD content library ........................... (85,154) (123,901)
Purchases of property and equipment ........................... (49,682) (33,837)
Other assets ............................................... 3,674 12,344
Non-GAAP free cash flow .............................. $186,550 131,007
34