NetFlix 2012 Annual Report Download - page 39
Download and view the complete annual report
Please find page 39 of the 2012 NetFlix annual report below. You can navigate through the pages in the report by either clicking on the pages listed below, or by using the keyword search tool below to find specific information within the annual report.-
 1
1 -
2
-
3
-
4
-
5
-
6
-
7
-
8
-
9
-
10
-
11
-
12
-
13
-
14
-
15
-
16
-
17
-
18
-
19
-
20
-
21
-
22
-
23
-
24
-
25
-
26
-
27
-
28
-
 29
29 -
 30
30 -
 31
31 -
 32
32 -
 33
33 -
 34
34 -
 35
35 -
 36
36 -
 37
37 -
 38
38 -
 39
39 -
 40
40 -
 41
41 -
 42
42 -
 43
43 -
 44
44 -
 45
45 -
 46
46 -
 47
47 -
 48
48 -
 49
49 -
50
-
51
-
52
-
53
-
54
-
55
-
56
-
57
-
58
-
59
-
60
-
61
-
62
-
63
-
64
-
65
-
66
-
67
-
68
-
69
-
70
-
71
-
72
-
73
-
74
-
75
-
76
-
77
-
78
-
79
-
80
-
81
-
82
-
83
-
84
-
85
-
86
-
87
-
88
 |
 |

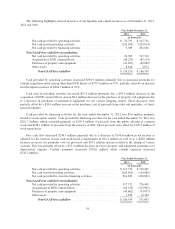
Cash provided by operating activities increased $41.3 million, primarily due to an increase subscription
revenues of $1,042.0 million or 48%. This increase was partially offset by increased payments for content
acquisition and licensing other than DVD library of $766.3 million or 138%. Operating cash flows were further
impacted by increases in payroll expenses and payments for advertising and affiliates transactions.
Cash used in investing activities increased $149.7 million, primarily due to a $164.0 million increase in the
purchases, net of proceeds from sales and maturities, of short-term investments. In addition, purchases of
property and equipment increased $15.8 million primarily due to purchases of automation equipment for our
various DVD shipping centers. These increases were partially offset by a $38.7 million decrease in acquisition of
DVD content library.
Cash provided by financing activities increased $361.7 million, primarily due to our public offering of
2.9 million shares of common stock for net proceeds of $199.9 million and $198.1 million net proceeds received
from the issuance of our Convertible Notes in the fourth quarter of 2011. In addition, repurchases of our common
stock decreased by $10.6 million. These increases were partially offset by a $30.2 million decrease in proceeds
from the issuance of common stock upon exercise of options and a $16.4 million decrease in excess tax benefits
from stock-based compensation expense.
Free cash flow increased $55.5 million, primarily due to an increase of $98.9 million in net income as
adjusted for the increase in non-cash stock-based compensation of $33.6 million and decreased tax prepayments
of $20.2 million. This was partially offset by an increase in excess content payments over expenses of
$53.2 million, a $12.9 million increase in excess property and equipment payments over expense and decreased
deferred revenues of $5.5 million. Payments for content increased $727.6 million while content expenses
increased $674.4 million.
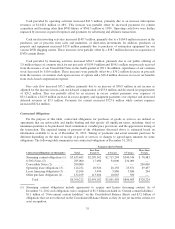
Contractual Obligations
For the purpose of this table, contractual obligations for purchases of goods or services are defined as
agreements that are enforceable and legally binding and that specify all significant terms, including: fixed or
minimum quantities to be purchased; fixed, minimum or variable price provisions; and the approximate timing of
the transaction. The expected timing of payment of the obligations discussed above is estimated based on
information available to us as of December 31, 2012. Timing of payments and actual amounts paid may be
different depending on the time of receipt of goods or services or changes to agreed-upon amounts for some
obligations. The following table summarizes our contractual obligations at December 31, 2012:
Payments due by Period
Contractual obligations (in thousands): Total
Less than
1 year (3) 1-3 years 3-5 years
More than
5 years
Streaming content obligations (1) $5,633,685 $2,299,562 $2,715,294 $540,346 $ 78,483
8.50% Notes (2) ............. 285,000 17,000 34,000 234,000 —
Convertible Notes (2) ......... 200,000 — — — 200,000
Operating lease obligations (3) . . 124,252 20,926 28,158 25,671 49,497
Lease financing obligations (3) . 15,106 3,090 5,886 5,886 244
Other purchase obligations (4) . . 132,169 113,604 18,065 500 —
Total .................. $6,390,212 $2,454,182 $2,801,403 $806,403 $328,224
(1) Streaming content obligations include agreements to acquire and license streaming content. As of
December 31, 2012 such obligations were comprised of $1.3 billion included in “Current content liabilities”,
$1.1 billion of “Non-current content liabilities” on the Consolidated Balance Sheets and $3.2 billion of
obligations that are not reflected on the Consolidated Balance Sheets as they do not yet meet the criteria for
asset recognition.
35