NetFlix 2012 Annual Report Download - page 33
Download and view the complete annual report
Please find page 33 of the 2012 NetFlix annual report below. You can navigate through the pages in the report by either clicking on the pages listed below, or by using the keyword search tool below to find specific information within the annual report.-
 1
1 -
2
-
3
-
4
-
5
-
6
-
7
-
8
-
9
-
10
-
11
-
12
-
13
-
14
-
15
-
16
-
17
-
18
-
19
-
20
-
21
-
22
-
 23
23 -
 24
24 -
 25
25 -
 26
26 -
 27
27 -
 28
28 -
 29
29 -
 30
30 -
 31
31 -
 32
32 -
 33
33 -
 34
34 -
 35
35 -
 36
36 -
 37
37 -
 38
38 -
 39
39 -
 40
40 -
 41
41 -
 42
42 -
 43
43 -
44
-
45
-
46
-
47
-
48
-
49
-
50
-
51
-
52
-
53
-
54
-
55
-
56
-
57
-
58
-
59
-
60
-
61
-
62
-
63
-
64
-
65
-
66
-
67
-
68
-
69
-
70
-
71
-
72
-
73
-
74
-
75
-
76
-
77
-
78
-
79
-
80
-
81
-
82
-
83
-
84
-
85
-
86
-
87
-
88
 |
 |

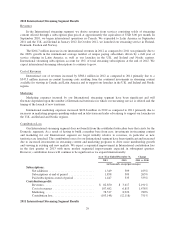
2012 International Streaming Segment Results
Revenues
In the International streaming segment, we derive revenues from services consisting solely of streaming
content offered through a subscription plan priced at approximately the equivalent of USD 8.00 per month. In
September 2010, we began international operations in Canada. We expanded to Latin America in September
2011 and the U.K. and Ireland in January 2012. In October 2012, we launched our streaming service in Finland,
Denmark, Sweden and Norway.
The $204.7 million increase in our international revenues in 2012 as compared to 2011 was primarily due to
the 260% growth in the international average number of unique paying subscribers driven by a full year of
service offering in Latin America as well as our launches in the U.K. and Ireland and Nordic regions.
International streaming subscriptions account for 18% of total streaming subscriptions at the end of 2012. We
expect international streaming subscriptions to continue to grow.
Cost of Revenues
International cost of revenues increased by $368.1 million in 2012 as compared to 2011 primarily due to a
$347.5 million increase in content licensing costs resulting from the continued investments in streaming content
available for viewing in Canada and Latin America and to support our launches in the U.K. and Ireland and Nordic
regions.
Marketing
Marketing expenses incurred by our International streaming segment have been significant and will
fluctuate dependent upon the number of International territories in which our streaming service is offered and the
timing of the launch of new territories.
International marketing expenses increased $122.8 million in 2012 as compared to 2011 primarily due to
increases in marketing program spending online and in television and radio advertising to support our launches in
the U.K. and Ireland and Nordic regions.
Contribution Loss
Our International streaming segment does not benefit from the established subscriber base that exists for the
Domestic segments. As a result of having to build a member base from zero, investments in streaming content
and marketing for our International segment are larger initially relative to revenues, in particular as new
territories are launched. The contribution losses for our International segment have been significant and increased
due to increased investments in streaming content and marketing programs to drive more membership growth
and viewing in existing and new markets. We expect a sequential improvement in International contribution loss
in the first quarter of 2013 with more modest sequential improvements expected in subsequent quarters.
However, contribution losses will continue to be significant as we expand internationally.
As of /Year Ended December 31, Change
2011 2010 2011 vs. 2010
(in thousands, except percentages)
Subscriptions:
Net additions ............................... 1,349 509 165%
Subscriptions at end of period ................. 1,858 509 265%
Paid subscriptions at end of period .............. 1,447 333 335%
Contribution profit:
Revenues .................................. $ 82,850 $ 3,617 2,191%
Cost of revenues ............................ 107,482 6,813 1,478%
Marketing ................................. 78,517 8,922 780%
Contribution loss ............................ (103,149) (12,118) 751%
2011 International Streaming Segment Results
29