NetFlix 2012 Annual Report Download - page 54
Download and view the complete annual report
Please find page 54 of the 2012 NetFlix annual report below. You can navigate through the pages in the report by either clicking on the pages listed below, or by using the keyword search tool below to find specific information within the annual report.-
 1
1 -
2
-
3
-
4
-
5
-
6
-
7
-
8
-
9
-
10
-
11
-
12
-
13
-
14
-
15
-
16
-
17
-
18
-
19
-
20
-
21
-
22
-
23
-
24
-
25
-
26
-
27
-
28
-
29
-
30
-
31
-
32
-
33
-
34
-
35
-
36
-
37
-
38
-
39
-
40
-
41
-
42
-
43
-
 44
44 -
 45
45 -
 46
46 -
 47
47 -
 48
48 -
 49
49 -
 50
50 -
 51
51 -
 52
52 -
 53
53 -
 54
54 -
 55
55 -
 56
56 -
 57
57 -
 58
58 -
 59
59 -
 60
60 -
 61
61 -
 62
62 -
 63
63 -
 64
64 -
65
-
66
-
67
-
68
-
69
-
70
-
71
-
72
-
73
-
74
-
75
-
76
-
77
-
78
-
79
-
80
-
81
-
82
-
83
-
84
-
85
-
86
-
87
-
88
 |
 |

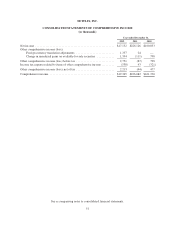
NETFLIX, INC.
CONSOLIDATED STATEMENTS OF OPERATIONS
(in thousands, except per share data)
Year ended December 31,
2012 2011 2010
Revenues .................................................. $3,609,282 $3,204,577 $2,162,625
Cost of revenues ............................................ 2,625,866 2,039,901 1,357,355
Marketing ............................................. 484,729 402,638 293,839
Technology and development .............................. 329,008 259,033 163,329
General and administrative ................................ 119,687 126,937 64,461
Operating income ........................................... 49,992 376,068 283,641
Other income (expense):
Interest expense ......................................... (19,986) (20,025) (19,629)
Interest and other income (expense) ......................... 474 3,479 3,684
Income before income taxes ................................... 30,480 359,522 267,696
Provision for income taxes .................................... 13,328 133,396 106,843
Net income ................................................ $ 17,152 $ 226,126 $ 160,853
Earnings per share:
Basic ................................................. $ 0.31 $ 4.28 $ 3.06
Diluted ................................................ $ 0.29 $ 4.16 $ 2.96
Weighted-average common shares outstanding:
Basic ................................................. 55,521 52,847 52,529
Diluted ................................................ 58,904 54,369 54,304
See accompanying notes to consolidated financial statements.
50