NetFlix 2008 Annual Report Download - page 77
Download and view the complete annual report
Please find page 77 of the 2008 NetFlix annual report below. You can navigate through the pages in the report by either clicking on the pages listed below, or by using the keyword search tool below to find specific information within the annual report.-
 1
1 -
2
-
3
-
4
-
5
-
6
-
7
-
8
-
9
-
10
-
11
-
12
-
13
-
14
-
15
-
16
-
17
-
18
-
19
-
20
-
21
-
22
-
23
-
24
-
25
-
26
-
27
-
28
-
29
-
30
-
31
-
32
-
33
-
34
-
35
-
36
-
37
-
38
-
39
-
40
-
41
-
42
-
43
-
44
-
45
-
46
-
47
-
48
-
49
-
50
-
51
-
52
-
53
-
54
-
55
-
56
-
57
-
58
-
59
-
60
-
61
-
62
-
63
-
64
-
65
-
66
-
 67
67 -
 68
68 -
 69
69 -
 70
70 -
 71
71 -
 72
72 -
 73
73 -
 74
74 -
 75
75 -
 76
76 -
 77
77 -
 78
78 -
 79
79 -
 80
80 -
 81
81 -
 82
82 -
 83
83 -
 84
84
 |
 |

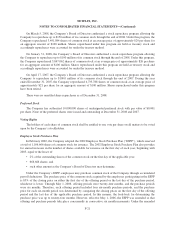
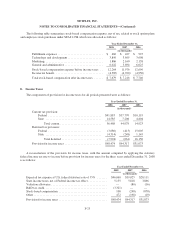
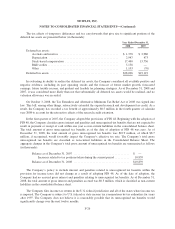
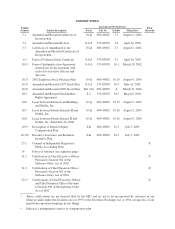
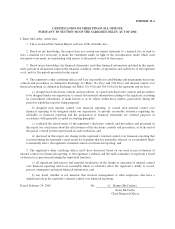
NETFLIX, INC.
NOTES TO CONSOLIDATED FINANCIAL STATEMENTS—(Continued)
December 31 September 30 June 30 March 31
2007
Total current assets ................................. $432,423 $424,799 $416,078 $ 429,401
Total assets ....................................... 678,998 653,169 637,664 651,277
Total liabilities and stockholder’s equity ................ 678,998 653,169 637,664 651,277
Net cash provided by operating activities ................ $ 87,607 $ 71,826 $ 60,997 $ 56,994
Net cash used in investing activities .................... (66,291) (46,360) (79,660) (243,713)
Net cash (used in) provided by financing activities ........ (23,681) (29,844) (15,613) 4,747
Total revenues ..................................... $302,355 $293,972 $303,693 $ 305,320
Gross profit ....................................... 102,305 99,519 107,000 110,348
Net income ....................................... 15,691 15,647 25,494 9,776
Net income per share:
Basic ........................................ 0.24 0.24 0.37 0.14
Diluted ....................................... 0.23 0.23 0.36 0.14
Subscribers at end of period .......................... 7,479 7,028 6,742 6,797
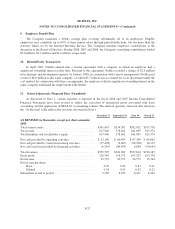
ADJUSTMENTS (in thousands, except per share
amounts)
2008
Total current assets ................................. — $ 33,010 $ 23,698 $ 27,596
Total assets ....................................... — (4,537) (4,124) 37,696
Total liabilities and stockholder’s equity ................ — (4,537) (4,124) 37,696
Net cash provided by operating activities ................ — $(12,736) $ (10,765) $ (13,685)
Net cash provided by (used) in investing activities ........ — 12,736 10,765 13,807
Net cash (used in) provided by financing activities ........ — — — (122)
Net income ....................................... — — — $ (34)
2007
Total current assets ................................. $ 15,891 $ 6,481 $ 5,508 $ 3,128
Total assets ....................................... 31,978 28,972 25,364 26,167
Total liabilities and stockholder’s equity ................ 31,978 28,972 25,364 26,167
Net cash provided by operating activities ................ $ 1,515 $ (5,739) $ (4,140) $ (6,035)
Net cash used in investing activities .................... (1,415) 5,837 4,237 6,130
Net cash (used in) provided by financing activities ........ (100) (98) (97) (95)
Net income ....................................... $ (85) $ (85) $ (86) $ (88)
Net income per share:
Basic ........................................ — — (0.01) —
Diluted ....................................... (0.01) — (0.01) —
F-28