NetFlix 2008 Annual Report Download - page 38
Download and view the complete annual report
Please find page 38 of the 2008 NetFlix annual report below. You can navigate through the pages in the report by either clicking on the pages listed below, or by using the keyword search tool below to find specific information within the annual report.-
 1
1 -
2
-
3
-
4
-
5
-
6
-
7
-
8
-
9
-
10
-
11
-
12
-
13
-
14
-
15
-
16
-
17
-
18
-
19
-
20
-
21
-
22
-
23
-
24
-
25
-
26
-
27
-
 28
28 -
 29
29 -
 30
30 -
 31
31 -
 32
32 -
 33
33 -
 34
34 -
 35
35 -
 36
36 -
 37
37 -
 38
38 -
 39
39 -
 40
40 -
 41
41 -
 42
42 -
 43
43 -
 44
44 -
 45
45 -
 46
46 -
 47
47 -
 48
48 -
49
-
50
-
51
-
52
-
53
-
54
-
55
-
56
-
57
-
58
-
59
-
60
-
61
-
62
-
63
-
64
-
65
-
66
-
67
-
68
-
69
-
70
-
71
-
72
-
73
-
74
-
75
-
76
-
77
-
78
-
79
-
80
-
81
-
82
-
83
-
84
 |
 |

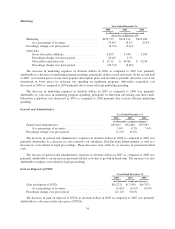
Fulfillment Expenses
Year Ended December 31,
2008 2007 2006
(in thousands, except percentages)
Fulfillment expenses ................................... $149,101 $121,761 $94,364
As a percentage of revenues ............................ 10.9% 10.1% 9.5%
Percentage change over prior period ....................... 22.5% 29.0%
The increase in fulfillment expenses in absolute dollars in 2008 as compared to 2007, and 2007 as compared
to 2006, was primarily attributable to an increase in personnel-related costs resulting from the higher volume of
activities in our shipping centers and customer service location, coupled with higher credit card fees as a result of
the growth in the average number of paying subscribers. In addition, the increase in fulfillment expenses was
attributable to an increase in facility-related costs resulting from the addition of new shipping centers, and for
2007, the expansion of our customer service center.
Gross Margin
Year Ended December 31,
2008 2007 2006
(in thousands, except percentages)
Gross profit .......................................... $454,427 $419,172 $369,675
Gross margin ........................................ 33.3% 34.8% 37.1%
The decrease in gross margin in 2008 as compared to 2007, and 2007 as compared to 2006, was primarily
due to an increase in postage rates effective May 2008 and 2007 and a reduction in the prices of our most popular
subscription plans during the second half of 2007. In addition, costs related to our streaming content have been
included in cost of subscriptions beginning January 2007.
We anticipate that gross margin will decline in 2009, due to increased investment in content library coupled
with an expected increase in postage rates effective May 2009.
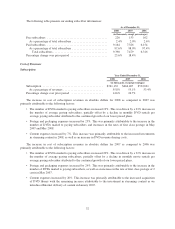
Operating Expenses
Technology and Development
Year Ended December 31,
2008 2007 2006
(in thousands, except percentages)
Technology and development .............................. $89,873 $70,979 $47,831
As a percentage of revenues ............................ 6.6% 5.9% 4.8%
Percentage change over prior period ......................... 26.6% 48.4%
The increase in technology and development expenses in absolute dollars for 2008 as compared to 2007 was
primarily the result of an increase in personnel-related costs due to growth in headcount and expenses related to
the development of solutions for streaming content and continued improvements to our service.
The increase in technology and development expenses in absolute dollars for 2007 as compared to 2006 was
primarily the result of an increase in personnel-related costs due to growth in headcount and expenses related to
the development of solutions for streaming content.
33