NetFlix 2008 Annual Report Download - page 63
Download and view the complete annual report
Please find page 63 of the 2008 NetFlix annual report below. You can navigate through the pages in the report by either clicking on the pages listed below, or by using the keyword search tool below to find specific information within the annual report.-
 1
1 -
2
-
3
-
4
-
5
-
6
-
7
-
8
-
9
-
10
-
11
-
12
-
13
-
14
-
15
-
16
-
17
-
18
-
19
-
20
-
21
-
22
-
23
-
24
-
25
-
26
-
27
-
28
-
29
-
30
-
31
-
32
-
33
-
34
-
35
-
36
-
37
-
38
-
39
-
40
-
41
-
42
-
43
-
44
-
45
-
46
-
47
-
48
-
49
-
50
-
51
-
52
-
 53
53 -
 54
54 -
 55
55 -
 56
56 -
 57
57 -
 58
58 -
 59
59 -
 60
60 -
 61
61 -
 62
62 -
 63
63 -
 64
64 -
 65
65 -
 66
66 -
 67
67 -
 68
68 -
 69
69 -
 70
70 -
 71
71 -
 72
72 -
 73
73 -
74
-
75
-
76
-
77
-
78
-
79
-
80
-
81
-
82
-
83
-
84
 |
 |

NETFLIX, INC.
NOTES TO CONSOLIDATED FINANCIAL STATEMENTS—(Continued)
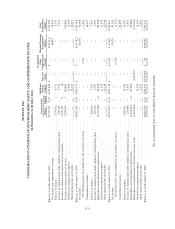
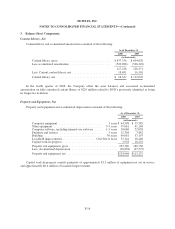
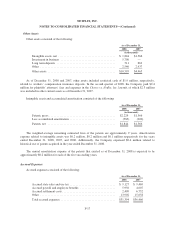
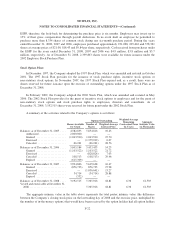
2. Short-term Investments
Short-term investments were classified as available-for-sale securities and are reported at fair value as
follows:
December 31, 2008
Gross
Amortized
Cost
Gross
Unrealized
Gains
Gross
Unrealized
Losses
Estimated
Fair Value
(in thousands)
Corporate debt securities ..................... $ 45,482 $ 440 $ (727) $ 45,195
Government and agency securities ............. 92,378 1,812 (244) 93,946
Asset and mortgage backed securities ........... 19,446 15 (1,212) 18,249
$157,306 $2,267 $(2,183) $157,390
December 31, 2007
Gross
Amortized
Cost
Gross
Unrealized
Gains
Gross
Unrealized
Losses
Estimated
Fair Value
(in thousands)
Corporate debt securities ..................... $ 36,445 $ 315 $ (85) $ 36,675
Government and agency securities ............. 130,884 2,155 (33) 133,006
Asset and mortgage backed securities ........... 37,842 307 (127) 38,022
$205,171 $2,777 $ (245) $207,703
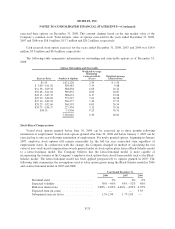
The following table shows the gross unrealized losses and fair value of the Company’s investments with
unrealized losses that are not deemed to be other-than-temporarily impaired, aggregated by investment category
and length of time that individual securities have been in a continuous unrealized loss position at December 31,
2008:
Less Than
12 Months
12 Months
or Greater Total
Fair
Value
Unrealized
Losses
Fair
Value
Unrealized
Losses
Fair
Value
Unrealized
Losses
(in thousands)
Corporate debt securities .................. $22,806 $ (692) $1,316 $ (35) $24,122 $ (727)
Government and agency securities .......... 12,128 (244) — — 12,128 (244)
Asset and mortgage backed securities ........ 15,511 (1,212) — — 15,511 (1,212)
$50,445 $(2,148) $1,316 $ (35) $51,761 $(2,183)
There were no investments which had been in a continuous loss position for more than twelve months as of
December 31, 2007.
The Company recognized gross realized gains of $4.9 million and gross realized losses of $1.8 million
during 2008 from the sales of available-for-sale securities. The Company recognized gross realized gains of $0.7
million during 2007 from the sales of available-for-sale securities. Realized gains and losses and interest income
are included in interest and other income (expense). There were no material other-than-temporary impairments
related to available-for-sale securities in 2008 or 2007.
F-14