NetFlix 2008 Annual Report Download - page 36
Download and view the complete annual report
Please find page 36 of the 2008 NetFlix annual report below. You can navigate through the pages in the report by either clicking on the pages listed below, or by using the keyword search tool below to find specific information within the annual report.-
 1
1 -
2
-
3
-
4
-
5
-
6
-
7
-
8
-
9
-
10
-
11
-
12
-
13
-
14
-
15
-
16
-
17
-
18
-
19
-
20
-
21
-
22
-
23
-
24
-
25
-
 26
26 -
 27
27 -
 28
28 -
 29
29 -
 30
30 -
 31
31 -
 32
32 -
 33
33 -
 34
34 -
 35
35 -
 36
36 -
 37
37 -
 38
38 -
 39
39 -
 40
40 -
 41
41 -
 42
42 -
 43
43 -
 44
44 -
 45
45 -
 46
46 -
47
-
48
-
49
-
50
-
51
-
52
-
53
-
54
-
55
-
56
-
57
-
58
-
59
-
60
-
61
-
62
-
63
-
64
-
65
-
66
-
67
-
68
-
69
-
70
-
71
-
72
-
73
-
74
-
75
-
76
-
77
-
78
-
79
-
80
-
81
-
82
-
83
-
84
 |
 |

Results of Operations
The following table sets forth, for the periods presented, the line items in our consolidated statements of
operations as a percentage of total revenues. The information contained in the table below should be read in
conjunction with the financial statements and notes thereto included in Item 8, Financial Statements and
Supplementary Data of this Annual Report on Form 10-K.
Year Ended December 31,
2008 2007 2006
Revenues ............................................................ 100.0% 100.0% 100.0%
Costs of revenues:
Subscription ..................................................... 55.8 55.1 53.4
Fulfillment expenses ............................................... 10.9 10.1 9.5
Total cost of revenues .......................................... 66.7 65.2 62.9
Gross profit .......................................................... 33.3 34.8 37.1
Operating expenses:
Technology and development ........................................ 6.6 5.9 4.8
Marketing ....................................................... 14.6 18.1 22.6
General and administrative .......................................... 3.6 4.3 3.6
Gain on disposal of DVDs .......................................... (0.4) (0.5) (0.5)
Gain on legal settlement ............................................ — (0.6) —
Total operating expenses ....................................... 24.4 27.2 30.5
Operating income ..................................................... 8.9 7.6 6.6
Other income (expense):
Interest expense on lease financing obligations .......................... (0.2) (0.1) (0.1)
Interest and other income (expense) ................................... 0.9 1.7 1.5
Income before income taxes ............................................. 9.6 9.2 8.0
Provision for income taxes .............................................. 3.5 3.7 3.1
Net income .......................................................... 6.1% 5.5% 4.9%
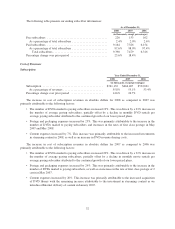
Revenues
Year Ended December 31,
2008 2007 2006
(in thousands, except percentages and average monthly
subscription revenue pre paying subscriber)
Revenues ...................................... $1,364,661 $1,205,340 $996,660
Percentage change over prior period ................ 13.2% 20.9%
Other data:
Average number of paying subscribers .......... 8,268 6,718 5,083
Percentage change over prior period ............ 23.1% 32.2%
Average monthly revenue per paying subscriber . . . $ 13.75 $ 14.95 $ 16.34
Percentage change over prior period ............ (8.0)% (8.5)%
The increase in our revenues in 2008 as compared to 2007, and 2007 as compared to 2006, was primarily a
result of the substantial growth in the average number of paying subscribers arising from increased consumer
awareness of the benefits of online movie and TV episode rentals and other aspects of our service. This increase
was offset in part by a decline in average monthly revenue per paying subscriber, resulting from the continued
growth in our lower cost subscription plans, as well as a price reduction for our most popular subscription plans
during the third quarter of 2007. We expect the average revenue per paying subscriber to continue to decline until
the mix of new subscribers and existing subscribers is approximately equivalent by subscription plan price point.
31