NetFlix 2008 Annual Report Download - page 41
Download and view the complete annual report
Please find page 41 of the 2008 NetFlix annual report below. You can navigate through the pages in the report by either clicking on the pages listed below, or by using the keyword search tool below to find specific information within the annual report.-
 1
1 -
2
-
3
-
4
-
5
-
6
-
7
-
8
-
9
-
10
-
11
-
12
-
13
-
14
-
15
-
16
-
17
-
18
-
19
-
20
-
21
-
22
-
23
-
24
-
25
-
26
-
27
-
28
-
29
-
30
-
 31
31 -
 32
32 -
 33
33 -
 34
34 -
 35
35 -
 36
36 -
 37
37 -
 38
38 -
 39
39 -
 40
40 -
 41
41 -
 42
42 -
 43
43 -
 44
44 -
 45
45 -
 46
46 -
 47
47 -
 48
48 -
 49
49 -
 50
50 -
 51
51 -
52
-
53
-
54
-
55
-
56
-
57
-
58
-
59
-
60
-
61
-
62
-
63
-
64
-
65
-
66
-
67
-
68
-
69
-
70
-
71
-
72
-
73
-
74
-
75
-
76
-
77
-
78
-
79
-
80
-
81
-
82
-
83
-
84
 |
 |

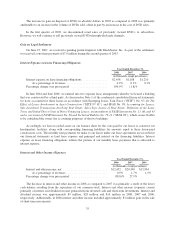
The increase in interest and other income in 2007 as compared to 2006 was primarily a result of our newly
invested short-term investment portfolio which was higher yielding than our money market funds, and higher
average cash balances.
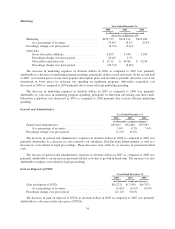
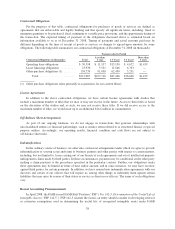
Provision for Income Taxes
Year Ended December 31,
2008 2007 2006
(in thousands, except percentages)
Provision for income taxes ................................. $48,474 $44,317 $31,073
Effective tax rate ........................................ 36.9% 40.0% 38.9%
In 2008, our effective tax rate differed from the federal statutory rate of 35% principally due to state income
taxes of $5 million or 4% of income before income tax. This was partially offset by R&D tax credits of $3
million. In 2007 and 2006, our effective tax rate differed from the federal statutory rate of 35% principally due to
state income taxes.
Liquidity and Capital Resources
We have generated net cash from operations during each quarter since the second quarter of 2001. Many
factors will impact our ability to continue to generate and grow cash from our operations including, but not
limited to, the number of subscribers who sign up for our service and the growth or reduction in our subscriber
base. In addition, we may have to or otherwise choose to lower our prices and increase our marketing expenses in
order to grow faster or respond to competition. Although we currently anticipate that cash flows from operations,
together with our available funds, will be sufficient to meet our cash needs for the foreseeable future, we may
require or choose to obtain additional financing. Our ability to obtain financing will depend on, among other
things, our development efforts, business plans, operating performance and the condition of the capital markets at
the time we seek financing.
Our primary source of liquidity has been cash from operations, which consists primarily of net income
adjusted for non-cash items such as amortization of our content library, depreciation of property and equipment
and stock-based compensation related to the issuance of common stock. Our primary uses of cash include our
stock repurchase programs, shipping and packaging expenses, the acquisition of content, capital expenditures
related to IT and automation equipment for operations, marketing and fulfillment expenses.
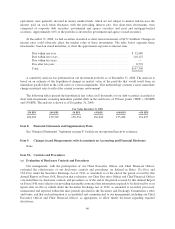
In 2009, operating cash flows will be a significant source of liquidity, while the shipping and packaging
expenses, acquisition of content, marketing and fulfillment expenses will continue to be significant uses of cash.
In addition, on January 26, 2009, we announced that our Board of Directors authorized a stock repurchase
program allowing us to repurchase our common stock through the end of 2009. Based on the Board’s
authorization, the Company anticipates a repurchase program of up to $175 million in 2009. The timing and
actual number of shares repurchased will depend on various factors including price, corporate and regulatory
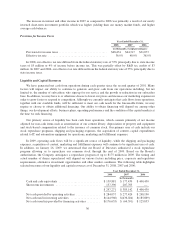
requirements, alternative investment opportunities and other market conditions. The following table highlights
selected measures of our liquidity and capital resources as of December 31, 2008, 2007 and 2006:
Year Ended December 31,
2008 2007 2006
(in thousands)
Cash and cash equivalents ............................ $139,881 $ 177,439 $ 400,430
Short-term investments .............................. 157,390 207,703 —
$ 297,271 $ 385,142 $ 400,430
Net cash provided by operating activities ................ $284,037 $ 277,424 $ 248,190
Net cash used in investing activities .................... $(144,960) $(436,024) $(185,869)
Net cash (used in) provided by financing activities ......... $(176,635) $ (64,391) $ 125,853
36