NetFlix 2008 Annual Report Download - page 37
Download and view the complete annual report
Please find page 37 of the 2008 NetFlix annual report below. You can navigate through the pages in the report by either clicking on the pages listed below, or by using the keyword search tool below to find specific information within the annual report.-
 1
1 -
2
-
3
-
4
-
5
-
6
-
7
-
8
-
9
-
10
-
11
-
12
-
13
-
14
-
15
-
16
-
17
-
18
-
19
-
20
-
21
-
22
-
23
-
24
-
25
-
26
-
 27
27 -
 28
28 -
 29
29 -
 30
30 -
 31
31 -
 32
32 -
 33
33 -
 34
34 -
 35
35 -
 36
36 -
 37
37 -
 38
38 -
 39
39 -
 40
40 -
 41
41 -
 42
42 -
 43
43 -
 44
44 -
 45
45 -
 46
46 -
 47
47 -
48
-
49
-
50
-
51
-
52
-
53
-
54
-
55
-
56
-
57
-
58
-
59
-
60
-
61
-
62
-
63
-
64
-
65
-
66
-
67
-
68
-
69
-
70
-
71
-
72
-
73
-
74
-
75
-
76
-
77
-
78
-
79
-
80
-
81
-
82
-
83
-
84
 |
 |

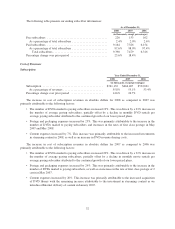
The following table presents our ending subscriber information:
As of December 31,
2008 2007 2006
(in thousands, except percentages)
Free subscribers ......................................... 226 153 162
As a percentage of total subscribers ........................ 2.4% 2.0% 2.6%
Paid subscribers ......................................... 9,164 7,326 6,154
As a percentage of total subscribers ........................ 97.6% 98.0% 97.4%
Total subscribers ..................................... 9,390 7,479 6,316
Percentage change over prior period ......................... 25.6% 18.4%
Cost of Revenues
Subscription
Year Ended December 31,
2008 2007 2006
(in thousands, except percentages)
Subscription ......................................... $761,133 $664,407 $532,621
As a percentage of revenues ........................... 55.8% 55.1% 53.4%
Percentage change over prior period ...................... 14.6% 24.7%
The increase in cost of subscription revenues in absolute dollars for 2008 as compared to 2007 was
primarily attributable to the following factors:
• The number of DVDs mailed to paying subscribers increased 19%. This was driven by a 23% increase in
the number of average paying subscribers, partially offset by a decline in monthly DVD rentals per
average paying subscriber attributed to the continued growth of our lower priced plans.
• Postage and packaging expenses increased by 23%. This was primarily attributable to the increase in the
number of DVDs mailed to paying subscribers and increases in the rates of first class postage in May
2007 and May 2008.
• Content expenses increased by 7%. This increase was primarily attributable to the increased investments
in streaming content in 2008, as well as an increase in DVD revenue sharing costs.
The increase in cost of subscription revenues in absolute dollars for 2007 as compared to 2006 was
primarily attributable to the following factors:
• The number of DVDs mailed to paying subscribers increased 20%. This was driven by a 32% increase in
the number of average paying subscribers, partially offset by a decline in monthly movie rentals per
average paying subscriber attributed to the continued growth of our lower priced plans.
• Postage and packaging expenses increased by 24%. This was primarily attributable to the increase in the
number of DVDs mailed to paying subscribers, as well as an increase in the rate of first class postage of 2
cents in May 2007.
• Content expenses increased by 26%. This increase was primarily attributable to the increased acquisition
of DVD library with the remaining increase attributable to the investment in streaming content as we
introduced Internet delivery of content in January 2007.
32