NetFlix 2008 Annual Report Download - page 73
Download and view the complete annual report
Please find page 73 of the 2008 NetFlix annual report below. You can navigate through the pages in the report by either clicking on the pages listed below, or by using the keyword search tool below to find specific information within the annual report.-
 1
1 -
2
-
3
-
4
-
5
-
6
-
7
-
8
-
9
-
10
-
11
-
12
-
13
-
14
-
15
-
16
-
17
-
18
-
19
-
20
-
21
-
22
-
23
-
24
-
25
-
26
-
27
-
28
-
29
-
30
-
31
-
32
-
33
-
34
-
35
-
36
-
37
-
38
-
39
-
40
-
41
-
42
-
43
-
44
-
45
-
46
-
47
-
48
-
49
-
50
-
51
-
52
-
53
-
54
-
55
-
56
-
57
-
58
-
59
-
60
-
61
-
62
-
 63
63 -
 64
64 -
 65
65 -
 66
66 -
 67
67 -
 68
68 -
 69
69 -
 70
70 -
 71
71 -
 72
72 -
 73
73 -
 74
74 -
 75
75 -
 76
76 -
 77
77 -
 78
78 -
 79
79 -
 80
80 -
 81
81 -
 82
82 -
 83
83 -
84
 |
 |

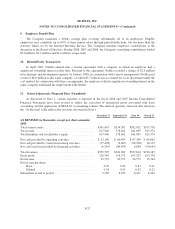
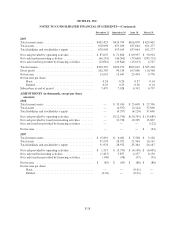
NETFLIX, INC.
NOTES TO CONSOLIDATED FINANCIAL STATEMENTS—(Continued)
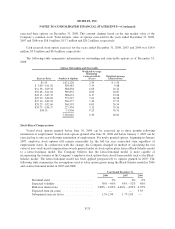
The fair value of shares issued under the ESPP is estimated using the Black-Scholes option pricing model.
The following table summarizes the assumptions used to value shares issued under the ESPP:
Year Ended December 31,
2008 2007 2006
Dividend yield ................................... 0% 0% 0%
Expected volatility ............................... 57% 42% 39%
Risk-free interest rate ............................. 1.41% 4.62% 5.07%
Expected life (in years) ............................ 0.5 0.5 0.5
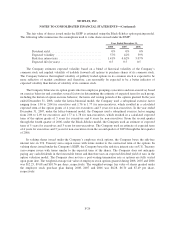
The Company estimates expected volatility based on a blend of historical volatility of the Company’s
common stock and implied volatility of tradable forward call options to purchase shares of its common stock.
The Company believes that implied volatility of publicly traded options in its common stock is expected to be
more reflective of market conditions and, therefore, can reasonably be expected to be a better indicator of
expected volatility than historical volatility of its common stock.
The Company bifurcates its option grants into two employee groupings (executive and non-executive) based
on exercise behavior and considers several factors in determining the estimate of expected term for each group,
including the historical option exercise behavior, the terms and vesting periods of the options granted. In the year
ended December 31, 2008, under the lattice-binomial model, the Company used a suboptimal exercise factor
ranging from 1.90 to 2.04 for executives and 1.76 to 1.77 for non-executives, which resulted in a calculated
expected term of the option grants of 4 years for executives and 3 years for non-executives. In the year ended
December 31, 2007, under the lattice-binomial model, the Company used a suboptimal exercise factor ranging
from 2.06 to 2.09 for executives and 1.77 to 1.78 for non-executives, which resulted in a calculated expected
term of the option grants of 5 years for executives and 4 years for non-executives. From the second quarter
through the fourth quarter of 2006, under the Black-Scholes model, the Company used an estimate of expected
term of 5 years for executives and 3 years for non-executives. The Company used an estimate of expected term
of 4 years for executives and 3 years for non-executives from the second quarter of 2005 through the first quarter
of 2006.
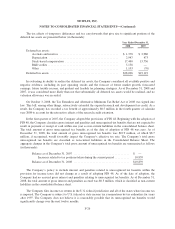
In valuing shares issued under the Company’s employee stock options, the Company bases the risk-free
interest rate on U.S. Treasury zero-coupon issues with terms similar to the contractual term of the options. In
valuing shares issued under the Company’s ESPP, the Company bases the risk-free interest rate on U.S. Treasury
zero-coupon issues with terms similar to the expected term of the shares. The Company does not anticipate
paying any cash dividends in the foreseeable future and therefore uses an expected dividend yield of zero in the
option valuation model. The Company does not use a post-vesting termination rate as options are fully vested
upon grant date. The weighted-average fair value of employee stock options granted during 2008, 2007 and 2006
was $12.25, $9.68 and $10.76 per share, respectively. The weighted-average fair value of shares granted under
the employee stock purchase plan during 2008, 2007 and 2006 was $8.28, $6.70 and $7.49 per share,
respectively.
F-24