NetFlix 2008 Annual Report Download - page 55
Download and view the complete annual report
Please find page 55 of the 2008 NetFlix annual report below. You can navigate through the pages in the report by either clicking on the pages listed below, or by using the keyword search tool below to find specific information within the annual report.-
 1
1 -
2
-
3
-
4
-
5
-
6
-
7
-
8
-
9
-
10
-
11
-
12
-
13
-
14
-
15
-
16
-
17
-
18
-
19
-
20
-
21
-
22
-
23
-
24
-
25
-
26
-
27
-
28
-
29
-
30
-
31
-
32
-
33
-
34
-
35
-
36
-
37
-
38
-
39
-
40
-
41
-
42
-
43
-
44
-
 45
45 -
 46
46 -
 47
47 -
 48
48 -
 49
49 -
 50
50 -
 51
51 -
 52
52 -
 53
53 -
 54
54 -
 55
55 -
 56
56 -
 57
57 -
 58
58 -
 59
59 -
 60
60 -
 61
61 -
 62
62 -
 63
63 -
 64
64 -
 65
65 -
66
-
67
-
68
-
69
-
70
-
71
-
72
-
73
-
74
-
75
-
76
-
77
-
78
-
79
-
80
-
81
-
82
-
83
-
84
 |
 |

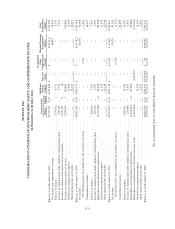
NETFLIX, INC.
CONSOLIDATED STATEMENTS OF CASH FLOWS
(in thousands)
Year Ended December 31,
2008 2007 2006
Cash flows from operating activities:
Net income ................................................... $ 83,026 $ 66,608 $ 48,839
Adjustments to reconcile net income to net cash provided by operating
activities:
Depreciation of property, equipment and intangibles .............. 32,454 22,219 16,648
Amortization of content library ............................... 209,757 203,415 141,160
Amortization of discounts and premiums on investments ........... 625 24 —
Stock-based compensation expense ............................ 12,264 11,976 12,696
Excess tax benefits from stock-based compensation ............... (5,220) (26,248) (13,217)
Loss (gain) on disposal of property and equipment ................ 101 142 (23)
Gain on sale of short-term investments ......................... (3,130) (687) —
Gain on disposal of DVDs ................................... (13,350) (14,637) (9,089)
Deferred taxes ............................................ (8,427) (893) 15,988
Changes in operating assets and liabilities:
Prepaid expenses and other current assets ................... (4,181) (3,893) (7,064)
Content library ........................................ (48,290) (34,821) —
Accounts payable ...................................... 7,111 16,555 3,208
Accrued expenses ...................................... (1,824) 32,809 17,559
Deferred revenue ...................................... 11,462 1,987 21,145
Other assets and liabilities ............................... 11,659 2,868 340
Net cash provided by operating activities ............... 284,037 277,424 248,190
Cash flows from investing activities:
Purchases of short-term investments ............................... (256,959) (405,340) —
Proceeds from sale of short-term investments ........................ 307,333 200,832 —
Purchases of property and equipment .............................. (43,790) (44,256) (27,333)
Acquisitions of intangible asset ................................... (1,062) (550) (585)
Acquisitions of content library .................................... (162,849) (208,647) (169,528)
Proceeds from sale of DVDs ..................................... 18,368 21,640 12,886
Investment in business .......................................... (6,000) — —
Other assets .................................................. (1) 297 (1,309)
Net cash used in investing activities ................... (144,960) (436,024) (185,869)
Cash flows from financing activities:
Principal payments of lease financing obligations ..................... (823) (390) (328)
Proceeds from issuance of common stock ........................... 18,872 9,609 112,964
Excess tax benefits from stock-based compensation ................... 5,220 26,248 13,217
Repurchases of common stock .................................... (199,904) (99,858) —
Net cash provided by (used in) financing activities ........ (176,635) (64,391) 125,853
Net (decrease) increase in cash and cash equivalents .................. (37,558) (222,991) 188,174
Cash and cash equivalents, beginning of year ........................ 177,439 400,430 212,256
Cash and cash equivalents, end of year ............................. $139,881 $ 177,439 $ 400,430
Supplemental disclosure:
Income taxes paid .............................................. $ (40,494) $ (15,775) $ (2,324)
Interest paid .................................................. (2,458) (1,188) (1,210)
See accompanying notes to consolidated financial statements.
F-6