NetFlix 2006 Annual Report Download - page 65
Download and view the complete annual report
Please find page 65 of the 2006 NetFlix annual report below. You can navigate through the pages in the report by either clicking on the pages listed below, or by using the keyword search tool below to find specific information within the annual report.-
 1
1 -
2
-
3
-
4
-
5
-
6
-
7
-
8
-
9
-
10
-
11
-
12
-
13
-
14
-
15
-
16
-
17
-
18
-
19
-
20
-
21
-
22
-
23
-
24
-
25
-
26
-
27
-
28
-
29
-
30
-
31
-
32
-
33
-
34
-
35
-
36
-
37
-
38
-
39
-
40
-
41
-
42
-
43
-
44
-
45
-
46
-
47
-
48
-
49
-
50
-
51
-
52
-
53
-
54
-
 55
55 -
 56
56 -
 57
57 -
 58
58 -
 59
59 -
 60
60 -
 61
61 -
 62
62 -
 63
63 -
 64
64 -
 65
65 -
 66
66 -
 67
67 -
 68
68 -
 69
69 -
 70
70 -
 71
71 -
 72
72 -
 73
73 -
 74
74 -
 75
75 -
76
-
77
-
78
-
79
-
80
-
81
-
82
-
83
-
84
-
85
-
86
-
87
 |
 |

NETFLIX, INC.
NOTES TO CONSOLIDATED FINANCIAL STATEMENTS—(Continued)
(in thousands, except share and per share data and percentages)
expensed as incurred except for advertising production costs, which are expensed the first time the advertising is
run. Advertising expense totaled approximately $91,799, $135,874 and $215,265 in 2004, 2005 and 2006,
respectively.
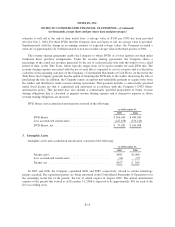
The Company and its vendors participate in a variety of cooperative advertising programs and other
promotional programs in which the vendors provide the Company with cash consideration in exchange for
marketing and advertising of the vendor’s products. If the consideration received represents reimbursement of
specific incremental and identifiable costs incurred to promote the vendor’s product, it is recorded as an offset to
the associated marketing expense incurred. Any reimbursement greater than the specific incremental and
identifiable costs incurred is recognized as a reduction of cost of revenues when recognized in the Company’s
statements of operations.
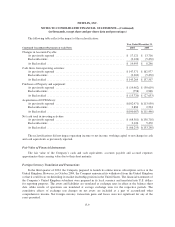
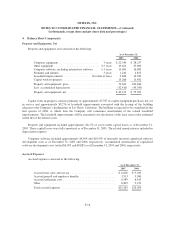
Income Taxes
The Company accounts for income taxes using the asset and liability method. Deferred income taxes are
recognized by applying enacted statutory tax rates applicable to future years to differences between the financial
statement carrying amounts of existing assets and liabilities and their respective tax bases and operating loss and
tax credit carryforwards. The effect on deferred tax assets and liabilities of a change in tax rates is recognized in
income in the period that includes the enactment date. The measurement of deferred tax assets is reduced, if
necessary, by a valuation allowance for any tax benefits for which future realization is uncertain.
Comprehensive Income (Loss)
The Company reports comprehensive income or loss in accordance with the provisions of SFAS No. 130,
Reporting Comprehensive Income, which establishes standards for reporting comprehensive income and its
components in the financial statements. The components of other comprehensive income (loss) consist of
unrealized gains and losses on available-for-sale securities and cumulative translation adjustments. Total
comprehensive loss and the components of accumulated other comprehensive income are presented in the
accompanying consolidated statements of stockholders’ equity. Tax effects of other comprehensive income (loss)
are not material for any period presented.
Net Income Per Share
Basic net income per share is computed using the weighted-average number of outstanding shares of
common stock during the period. Diluted net income per share is computed using the weighted-average number
of outstanding shares of common stock and, when dilutive, potential common shares outstanding during the
period. Potential common shares consist primarily of incremental shares issuable upon the assumed exercise of
stock options, warrants to purchase common stock and shares currently purchasable pursuant to our employee
stock purchase plan using the treasury stock method.
The shares used in the computation of net income per share are as follows (rounded to the nearest thousand):
Year Ended December 31,
2004 2005 2006
Weighted-average shares outstanding—basic ...... 51,988,000 53,528,000 62,577,000
Effect of dilutive potential common shares:
Warrants .............................. 8,571,000 8,354,000 4,093,000
Employee stock options .................. 4,154,000 3,636,000 2,405,000
Weighted-average shares outstanding—diluted .... 64,713,000 65,518,000 69,075,000
F-12