NetFlix 2006 Annual Report Download - page 33
Download and view the complete annual report
Please find page 33 of the 2006 NetFlix annual report below. You can navigate through the pages in the report by either clicking on the pages listed below, or by using the keyword search tool below to find specific information within the annual report.-
 1
1 -
2
-
3
-
4
-
5
-
6
-
7
-
8
-
9
-
10
-
11
-
12
-
13
-
14
-
15
-
16
-
17
-
18
-
19
-
20
-
21
-
22
-
 23
23 -
 24
24 -
 25
25 -
 26
26 -
 27
27 -
 28
28 -
 29
29 -
 30
30 -
 31
31 -
 32
32 -
 33
33 -
 34
34 -
 35
35 -
 36
36 -
 37
37 -
 38
38 -
 39
39 -
 40
40 -
 41
41 -
 42
42 -
 43
43 -
44
-
45
-
46
-
47
-
48
-
49
-
50
-
51
-
52
-
53
-
54
-
55
-
56
-
57
-
58
-
59
-
60
-
61
-
62
-
63
-
64
-
65
-
66
-
67
-
68
-
69
-
70
-
71
-
72
-
73
-
74
-
75
-
76
-
77
-
78
-
79
-
80
-
81
-
82
-
83
-
84
-
85
-
86
-
87
 |
 |

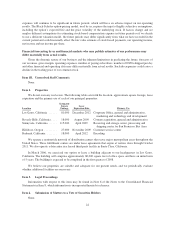
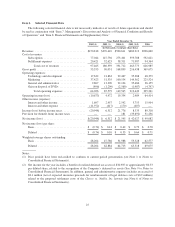
Item 6. Selected Financial Data
The following selected financial data is not necessarily indicative of results of future operations and should
be read in conjunction with “Item 7. Management’s Discussion and Analysis of Financial Condition and Results
of Operations” and “Item 8. Financial Statements and Supplementary Data.”
Year Ended December 31,
2002 (1) 2003 (1) 2004 (1) 2005 (1)(2) 2006
(in thousands, except per share data)
Revenues ................................... $150,818 $270,410 $500,611 $682,213 $996,660
Cost of revenues:
Subscription ............................. 77,044 147,736 273,401 393,788 532,621
Fulfillment expenses ...................... 20,421 32,623 58,311 71,987 94,364
Total cost of revenues ................. 97,465 180,359 331,712 465,775 626,985
Gross profit .................................. 53,353 90,051 168,899 216,438 369,675
Operating expenses:
Technology and development ............... 17,632 21,863 29,467 35,388 48,379
Marketing ............................... 37,423 51,535 100,534 144,562 225,524
General and administrative ................. 9,867 13,390 22,104 35,486 36,155
Gain on disposal of DVDs .................. (896) (1,209) (2,560) (1,987) (4,797)
Total operating expenses ............... 64,026 85,579 149,545 213,449 305,261
Operating income (loss) ........................ (10,673) 4,472 19,354 2,989 64,414
Other income (expense):
Interest and other income ................... 1,697 2,457 2,592 5,753 15,904
Interest and other expense .................. (11,972) (417) (170) (407) —
Income (loss) before income taxes ................ (20,948) 6,512 21,776 8,335 80,318
Provision for (benefit from) income taxes .......... — — 181 (33,692) 31,236
Net income (loss) ............................. $(20,948) $ 6,512 $ 21,595 $ 42,027 $ 49,082
Net income (loss) per share:
Basic ................................... $ (0.74) $ 0.14 $ 0.42 $ 0.79 $ 0.78
Diluted ................................. $ (0.74) $ 0.10 $ 0.33 $ 0.64 $ 0.71
Weighted-average shares outstanding:
Basic ................................... 28,204 47,786 51,988 53,528 62,577
Diluted ................................. 28,204 62,884 64,713 65,518 69,075
Notes:
(1) Prior periods have been reclassified to conform to current period presentation (see Note 1 to Notes to
Consolidated Financial Statements).
(2) Net income for the year includes a benefit of realized deferred tax assets of $34,905 or approximately $0.53
per diluted share, related to the recognition of the Company’s deferred tax assets (See Note 9 to Notes to
Consolidated Financial Statements). In addition, general and administrative expenses includes an accrual of
$8.1 million (net of expected insurance proceeds for reimbursement of legal defense costs of $0.9 million)
related to the proposed settlement costs of the Chavez vs. Netflix, Inc. lawsuit (see Note 6 of Notes to
Consolidated Financial Statements).
25