NetFlix 2006 Annual Report Download - page 32
Download and view the complete annual report
Please find page 32 of the 2006 NetFlix annual report below. You can navigate through the pages in the report by either clicking on the pages listed below, or by using the keyword search tool below to find specific information within the annual report.-
 1
1 -
2
-
3
-
4
-
5
-
6
-
7
-
8
-
9
-
10
-
11
-
12
-
13
-
14
-
15
-
16
-
17
-
18
-
19
-
20
-
21
-
 22
22 -
 23
23 -
 24
24 -
 25
25 -
 26
26 -
 27
27 -
 28
28 -
 29
29 -
 30
30 -
 31
31 -
 32
32 -
 33
33 -
 34
34 -
 35
35 -
 36
36 -
 37
37 -
 38
38 -
 39
39 -
 40
40 -
 41
41 -
 42
42 -
43
-
44
-
45
-
46
-
47
-
48
-
49
-
50
-
51
-
52
-
53
-
54
-
55
-
56
-
57
-
58
-
59
-
60
-
61
-
62
-
63
-
64
-
65
-
66
-
67
-
68
-
69
-
70
-
71
-
72
-
73
-
74
-
75
-
76
-
77
-
78
-
79
-
80
-
81
-
82
-
83
-
84
-
85
-
86
-
87
 |
 |
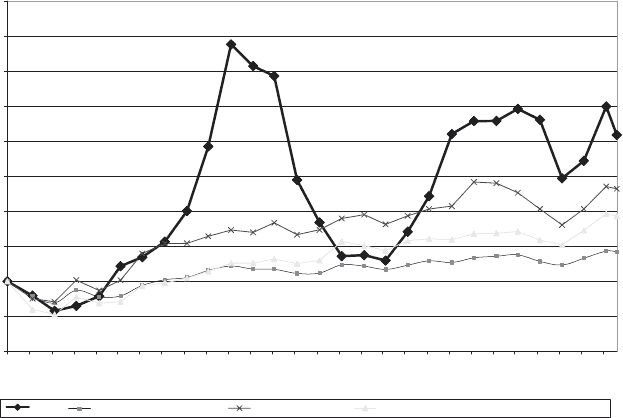
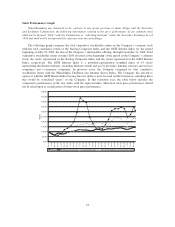
Stock Performance Graph
Notwithstanding any statement to the contrary in any of our previous or future filings with the Securities
and Exchange Commission, the following information relating to the price performance of our common stock
shall not be deemed “filed” with the Commission or “soliciting material” under the Securities Exchange Act of
1934 and shall not be incorporated by reference into any such filings.
The following graph compares the total cumulative stockholder return on the Company’s common stock
with the total cumulative return of the Nasdaq Composite Index and the GSTI Internet Index for the period
beginning on May 23, 2002, the date of the Company’s initial public offering, through December 31, 2006. Total
cumulative stockholder return assumes $100 invested at the beginning of the period in the Company’s common
stock, the stocks represented in the Nasdaq Composite Index and the stocks represented in the GSTI Internet
Index, respectively. The GSTI Internet Index is a modified-capitalization weighted index of 14 stocks
representing the Internet industry, including Internet content and access providers, Internet software and services
companies and e-commerce companies. In previous years, the Company compared its total cumulative
stockholder return with the Philadelphia TheStreet.com Internet Sector Index. The Company has elected to
replace it with the GSTI Internet Index because the new index is more focused on like businesses, including those
that would be considered “peers” of the Company. In this transition year, the table below includes the
comparative performance of the new index with the replaced index. Historical stock price performance should
not be relied upon as an indication of future stock price performance:
$0.00
$50.00
$100.00
$150.00
$200.00
$250.00
$300.00
$350.00
$400.00
$450.00
$500.00
May-02
Jul-02
Sep-02
Nov-02
Jan-03
Mar-03
May-03
Jul-03
Sep-03
Nov-03
Jan-04
Mar-04
May-04
Jul-04
Sep-04
Nov-04
Jan-05
Mar-05
May-05
Jul-05
Sep-05
Nov-05
Jan-06
Mar-06
May-06
Jul-06
Sep-06
Nov-06
Dollars
NFLX NASDAQ Composite Index GSTI Internet Index Philadelphia TheStreet.com Internet Sector Index
24