NetFlix 2006 Annual Report Download - page 46
Download and view the complete annual report
Please find page 46 of the 2006 NetFlix annual report below. You can navigate through the pages in the report by either clicking on the pages listed below, or by using the keyword search tool below to find specific information within the annual report.-
 1
1 -
2
-
3
-
4
-
5
-
6
-
7
-
8
-
9
-
10
-
11
-
12
-
13
-
14
-
15
-
16
-
17
-
18
-
19
-
20
-
21
-
22
-
23
-
24
-
25
-
26
-
27
-
28
-
29
-
30
-
31
-
32
-
33
-
34
-
35
-
 36
36 -
 37
37 -
 38
38 -
 39
39 -
 40
40 -
 41
41 -
 42
42 -
 43
43 -
 44
44 -
 45
45 -
 46
46 -
 47
47 -
 48
48 -
 49
49 -
 50
50 -
 51
51 -
 52
52 -
 53
53 -
 54
54 -
 55
55 -
 56
56 -
57
-
58
-
59
-
60
-
61
-
62
-
63
-
64
-
65
-
66
-
67
-
68
-
69
-
70
-
71
-
72
-
73
-
74
-
75
-
76
-
77
-
78
-
79
-
80
-
81
-
82
-
83
-
84
-
85
-
86
-
87
 |
 |

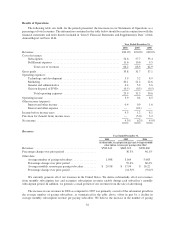
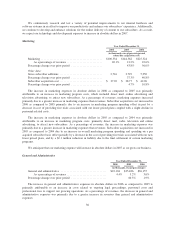
In 2006 our effective tax rate differed from the federal statutory rate of 35% principally due to state income
taxes and benefits related to stock-based compensation. In 2005, we recorded an income tax benefit of
$33.7 million on pretax income of $8.3 million. Our 2005 income tax benefit includes a tax benefit for the
reduction in the valuation allowance of $34.9 million. We continuously monitor the circumstances impacting the
expected realization of our deferred tax assets. In the fourth quarter of 2005 we reduced the valuation allowance
after determining that substantially all deferred tax assets are more likely than not to be realizable due to
expected future income. In 2004, we recorded an income tax provision of $0.2 million on a pre-tax income of
$21.8 million. Our effective tax rates for 2004 and 2005 differ from the federal statutory rate of 35% primarily
due to changes in the valuation allowance and benefits related to stock based compensation.
We currently anticipate that our effective tax rate will be approximately 40% in 2007.
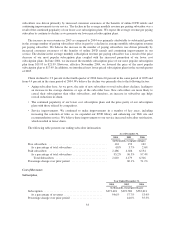
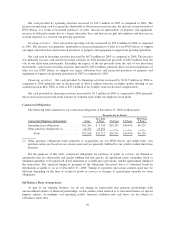
Liquidity and Capital Resources
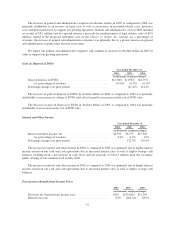
As of December 31, 2006, we had cash and cash equivalents of $400.4 million. On May 3, 2006, we issued
3.5 million shares of common stock upon the closing of a secondary public offering for net proceeds of $101.1
million. We intend to use the net proceeds from the sale of the common stock for general corporate purposes,
including working capital.
We have generated net cash from operations during each quarter since the second quarter of 2001. Many
factors will impact our ability to continue to generate and grow cash from our operations including, but not
limited to, the number of subscribers who sign up for our service, the growth or reduction in our subscriber base,
and our ability to develop new revenue sources. In addition, we may have to or otherwise choose to lower our
prices and increase our marketing expenses in order to grow faster or respond to competition. Although we
currently anticipate that cash flows from operations, together with our available funds, will be sufficient to meet
our cash needs for the foreseeable future, we may require or choose to obtain additional financing. Our ability to
obtain financing will depend on, among other things, our development efforts, business plans, operating
performance and the condition of the capital markets at the time we seek financing.
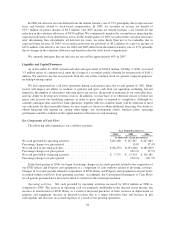
Key Components of Cash Flow:
The following table summarizes our cash flow activities:
Year Ended December 31,
2004 2005 2006
(in thousands, except percentages)
Net cash provided by operating activities .......................... $145,269 $ 157,507 $ 247,862
Percentage change over prior period .............................. 8.4% 57.4%
Net cash used in investing activities .............................. $(66,255) $(133,248) $(185,869)
Percentage change over prior period .............................. 101.1% 39.5%
Net cash provided by financing activities .......................... $ 5,775 $ 13,314 $ 126,181
Percentage change over prior period .............................. 130.5% 847.7%
In the third quarter of 2006, we began classifying changes in Accounts payable related to the acquisition of
our DVD library and Property and equipment as a component of cash outflows related to investing activities.
Changes in Accounts payable related to acquisitions of DVD library and Property and equipment were previously
classified within cash flows from operating activities. Accordingly, the Consolidated Statements of Cash Flows
for all periods presented have been reclassified to conform to the current presentation.
Operating activities: Net cash provided by operating activities increased by $90.4 million in 2006 as
compared to 2005. The increase in operating cash was primarily attributable to the increase in net income, the
increase in amortization of DVD library as a result of increased purchases of titles, increase in depreciation of
property and equipment, increase in deferred revenue due to a larger subscriber base and increase in gift
subscriptions and increases in accrued expenses as a result of our growing operations.
38