NetFlix 2006 Annual Report Download - page 60
Download and view the complete annual report
Please find page 60 of the 2006 NetFlix annual report below. You can navigate through the pages in the report by either clicking on the pages listed below, or by using the keyword search tool below to find specific information within the annual report.-
 1
1 -
2
-
3
-
4
-
5
-
6
-
7
-
8
-
9
-
10
-
11
-
12
-
13
-
14
-
15
-
16
-
17
-
18
-
19
-
20
-
21
-
22
-
23
-
24
-
25
-
26
-
27
-
28
-
29
-
30
-
31
-
32
-
33
-
34
-
35
-
36
-
37
-
38
-
39
-
40
-
41
-
42
-
43
-
44
-
45
-
46
-
47
-
48
-
49
-
 50
50 -
 51
51 -
 52
52 -
 53
53 -
 54
54 -
 55
55 -
 56
56 -
 57
57 -
 58
58 -
 59
59 -
 60
60 -
 61
61 -
 62
62 -
 63
63 -
 64
64 -
 65
65 -
 66
66 -
 67
67 -
 68
68 -
 69
69 -
 70
70 -
71
-
72
-
73
-
74
-
75
-
76
-
77
-
78
-
79
-
80
-
81
-
82
-
83
-
84
-
85
-
86
-
87
 |
 |

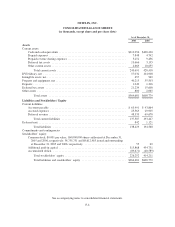
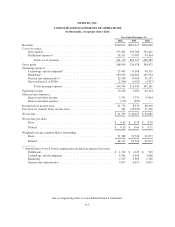
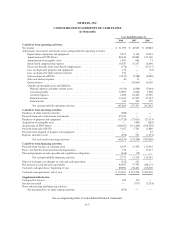
NETFLIX, INC.
CONSOLIDATED STATEMENTS OF CASH FLOWS
(in thousands)
Year Ended December 31,
2004 2005 2006
Cash flows from operating activities:
Net income ............................................................ $ 21,595 $ 42,027 $ 49,082
Adjustments to reconcile net income to net cash provided by operating activities:
Depreciation of property and equipment .................................. 5,871 9,134 15,903
Amortization of DVD library .......................................... 80,346 96,883 141,160
Amortization of intangible assets ....................................... 1,987 985 73
Stock-based compensation expense ..................................... 16,587 14,327 12,696
Excess tax benefits from stock-based compensation ........................ (176) — (13,217)
Loss on disposal of property and equipment ............................... 135 — (23)
Loss on disposal of short-term investments ............................... 274 — —
Gain on disposal of DVDs ............................................ (2,912) (3,588) (9,089)
Non-cash interest expense ............................................. 44 11 —
Deferred taxes ...................................................... — (34,905) 16,150
Changes in operating assets and liabilities:
Prepaid expenses and other current assets ............................... (9,130) (4,884) (7,064)
Accounts payable ................................................. 14,995 8,246 3,208
Accrued expenses ................................................. 1,682 12,432 17,559
Deferred revenue .................................................. 13,612 16,597 21,145
Deferred rent ..................................................... 359 242 279
Net cash provided by operating activities ............................. 145,269 157,507 247,862
Cash flows from investing activities:
Purchases of short-term investments ......................................... (586) — —
Proceeds from sale of short-term investments ................................. 45,013 — —
Purchases of property and equipment ........................................ (15,720) (27,653) (27,333)
Acquisition of intangible asset ............................................. — (481) (585)
Acquisitions of DVD library ............................................... (100,087) (111,446) (169,528)
Proceeds from sale of DVDs ............................................... 5,617 5,781 12,886
Proceeds from disposal of property and equipment ............................. — — 23
Deposits and other assets .................................................. (492) 551 (1,332)
Net cash used in investing activities ................................. (66,255) (133,248) (185,869)
Cash flows from financing activities:
Proceeds from issuance of common stock .................................... 6,035 13,393 112,964
Excess tax benefits from stock-based compensation ............................ 176 — 13,217
Principal payments on notes payable and capital lease obligations ................. (436) (79) —
Net cash provided by financing activities ............................. 5,775 13,314 126,181
Effect of exchange rate changes on cash and cash equivalents ..................... (222) 222 —
Net increase in cash and cash equivalents ..................................... 84,567 37,795 188,174
Cash and cash equivalents, beginning of year .................................. 89,894 174,461 212,256
Cash and cash equivalents, end of year ....................................... $174,461 $ 212,256 $ 400,430
Supplemental disclosure:
Cash paid for interest ..................................................... 109 170 —
Income taxes paid ....................................................... — (977) (2,324)
Non-cash investing and financing activities:
Net unrealized loss on short-term investments ............................. (870) — —
See accompanying notes to consolidated financial statements.
F-7