NetFlix 2006 Annual Report Download - page 58
Download and view the complete annual report
Please find page 58 of the 2006 NetFlix annual report below. You can navigate through the pages in the report by either clicking on the pages listed below, or by using the keyword search tool below to find specific information within the annual report.-
 1
1 -
2
-
3
-
4
-
5
-
6
-
7
-
8
-
9
-
10
-
11
-
12
-
13
-
14
-
15
-
16
-
17
-
18
-
19
-
20
-
21
-
22
-
23
-
24
-
25
-
26
-
27
-
28
-
29
-
30
-
31
-
32
-
33
-
34
-
35
-
36
-
37
-
38
-
39
-
40
-
41
-
42
-
43
-
44
-
45
-
46
-
47
-
 48
48 -
 49
49 -
 50
50 -
 51
51 -
 52
52 -
 53
53 -
 54
54 -
 55
55 -
 56
56 -
 57
57 -
 58
58 -
 59
59 -
 60
60 -
 61
61 -
 62
62 -
 63
63 -
 64
64 -
 65
65 -
 66
66 -
 67
67 -
 68
68 -
69
-
70
-
71
-
72
-
73
-
74
-
75
-
76
-
77
-
78
-
79
-
80
-
81
-
82
-
83
-
84
-
85
-
86
-
87
 |
 |

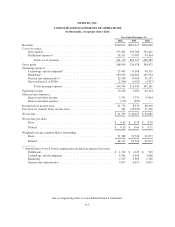
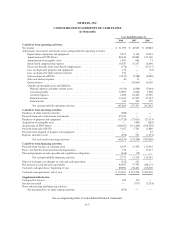
NETFLIX, INC.
CONSOLIDATED STATEMENTS OF OPERATIONS
(in thousands, except per share data)
Year Ended December 31,
2004 2005 2006
Revenues ...................................................... $500,611 $682,213 $996,660
Cost of revenues:
Subscription ................................................ 273,401 393,788 532,621
Fulfillment expenses* ........................................ 58,311 71,987 94,364
Total cost of revenues .................................... 331,712 465,775 626,985
Gross profit ..................................................... 168,899 216,438 369,675
Operating expenses:
Technology and development* ................................. 29,467 35,388 48,379
Marketing* ................................................. 100,534 144,562 225,524
General and administrative* ................................... 22,104 35,486 36,155
Gain on disposal of DVDs ..................................... (2,560) (1,987) (4,797)
Total operating expenses .................................. 149,545 213,449 305,261
Operating income ................................................ 19,354 2,989 64,414
Other income (expense):
Interest and other income ...................................... 2,592 5,753 15,904
Interest and other expense ..................................... (170) (407) —
Income before income taxes ........................................ 21,776 8,335 80,318
Provision for (benefit from) income taxes ............................. 181 (33,692) 31,236
Net income ..................................................... $ 21,595 $ 42,027 $ 49,082
Net income per share:
Basic ...................................................... $ 0.42 $ 0.79 $ 0.78
Diluted .................................................... $ 0.33 $ 0.64 $ 0.71
Weighted-average common shares outstanding:
Basic ...................................................... 51,988 53,528 62,577
Diluted .................................................... 64,713 65,518 69,075
* Amortization of stock-based compensation included in expense line items:
Fulfillment ................................................. $ 1,702 $ 1,225 $ 925
Technology and development .................................. 6,561 4,446 3,608
Marketing .................................................. 2,507 2,565 2,138
General and administrative .................................... 5,817 6,091 6,025
See accompanying notes to consolidated financial statements.
F-5