NetFlix 2006 Annual Report Download - page 41
Download and view the complete annual report
Please find page 41 of the 2006 NetFlix annual report below. You can navigate through the pages in the report by either clicking on the pages listed below, or by using the keyword search tool below to find specific information within the annual report.-
 1
1 -
2
-
3
-
4
-
5
-
6
-
7
-
8
-
9
-
10
-
11
-
12
-
13
-
14
-
15
-
16
-
17
-
18
-
19
-
20
-
21
-
22
-
23
-
24
-
25
-
26
-
27
-
28
-
29
-
30
-
 31
31 -
 32
32 -
 33
33 -
 34
34 -
 35
35 -
 36
36 -
 37
37 -
 38
38 -
 39
39 -
 40
40 -
 41
41 -
 42
42 -
 43
43 -
 44
44 -
 45
45 -
 46
46 -
 47
47 -
 48
48 -
 49
49 -
 50
50 -
 51
51 -
52
-
53
-
54
-
55
-
56
-
57
-
58
-
59
-
60
-
61
-
62
-
63
-
64
-
65
-
66
-
67
-
68
-
69
-
70
-
71
-
72
-
73
-
74
-
75
-
76
-
77
-
78
-
79
-
80
-
81
-
82
-
83
-
84
-
85
-
86
-
87
 |
 |

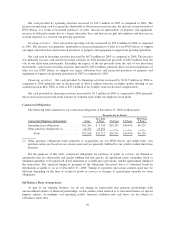
subscribers was driven primarily by increased consumer awareness of the benefits of online DVD rentals and
continuing improvements in our service. The decline in the average monthly revenue per paying subscriber was a
result of the continued popularity of our lower cost subscription plans. We expect the average revenue per paying
subscriber to continue to decline as we promote our lower priced subscription plans.
The increase in our revenues in 2005 as compared to 2004 was primarily attributable to substantial growth
in the average number of paying subscribers offset in part by a decline in average monthly subscription revenue
per paying subscriber. We believe the increase in the number of paying subscribers was driven primarily by
increased consumer awareness of the benefits of online DVD rentals and continuing improvements in our
service. The decline in the average monthly subscription revenue per paying subscriber was a result of the price
decrease of our most popular subscription plan coupled with the increased promotion of our lower cost
subscription plans. In June 2004, we increased the monthly subscription price of our most popular subscription
plan from $19.95 to $21.99. However, effective November 2004, we lowered the price of the most popular
subscription plan to $17.99. In addition, we introduced new lower priced subscription plans in the second quarter
of 2005.
Churn declined to 3.9 percent in the fourth quarter of 2006 from 4.0 percent in the same period of 2005 and
from 4.4 percent in the same period of 2004. We believe the decline was primarily due to the following factors:
• Aging subscriber base. As we grow, the ratio of new subscribers to total subscribers declines, leading to
an increase in the average duration, or age, of the subscriber base. New subscribers are more likely to
cancel their subscriptions than older subscribers, and therefore, an increase in subscriber age helps
overall reductions in churn.
• The continued popularity of our lower cost subscription plans and the price parity of our subscription
plans with those offered by competitors.
• Service improvements. We continued to make improvements in a number of key areas, including
increasing the selection of titles as we expanded our DVD library and enhancing our Web site and
recommendation service. We believe these improvements to our service increased subscriber satisfaction,
which resulted in lower churn.
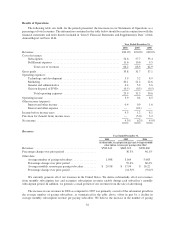
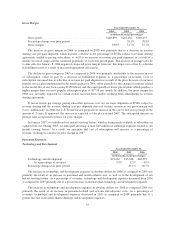
The following table presents our ending subscriber information:
As of December 31,
2004 2005 2006
(in thousands, except percentages)
Free subscribers ......................................... 124 153 162
As a percentage of total subscribers ........................ 4.8% 3.7% 2.6%
Paid subscribers ......................................... 2,486 4,026 6,154
As a percentage of total subscribers ........................ 95.2% 96.3% 97.4%
Total Subscribers .................................... 2,610 4,179 6,316
Percentage change over prior period ......................... 60.1% 51.1%
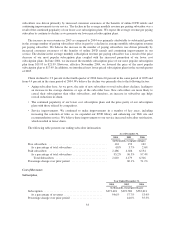
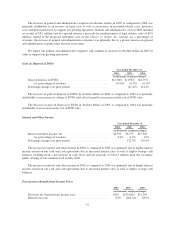
Cost of Revenues
Subscription
Year Ended December 31,
2004 2005 2006
(in thousands, except percentages)
Subscription ......................................... $273,401 $393,788 $532,621
As a percentage of revenues ........................... 54.6% 57.7% 53.4%
Percentage change over prior period ...................... 44.0% 35.3%
33