NetFlix 2006 Annual Report Download - page 47
Download and view the complete annual report
Please find page 47 of the 2006 NetFlix annual report below. You can navigate through the pages in the report by either clicking on the pages listed below, or by using the keyword search tool below to find specific information within the annual report.-
 1
1 -
2
-
3
-
4
-
5
-
6
-
7
-
8
-
9
-
10
-
11
-
12
-
13
-
14
-
15
-
16
-
17
-
18
-
19
-
20
-
21
-
22
-
23
-
24
-
25
-
26
-
27
-
28
-
29
-
30
-
31
-
32
-
33
-
34
-
35
-
36
-
 37
37 -
 38
38 -
 39
39 -
 40
40 -
 41
41 -
 42
42 -
 43
43 -
 44
44 -
 45
45 -
 46
46 -
 47
47 -
 48
48 -
 49
49 -
 50
50 -
 51
51 -
 52
52 -
 53
53 -
 54
54 -
 55
55 -
 56
56 -
 57
57 -
58
-
59
-
60
-
61
-
62
-
63
-
64
-
65
-
66
-
67
-
68
-
69
-
70
-
71
-
72
-
73
-
74
-
75
-
76
-
77
-
78
-
79
-
80
-
81
-
82
-
83
-
84
-
85
-
86
-
87
 |
 |

Net cash provided by operating activities increased by $12.2 million in 2005 as compared to 2004. The
increase in operating cash was primarily attributable to the increase in net income, the increase in amortization of
DVD library as a result of increased purchases of titles, increase in depreciation of property and equipment,
increase in deferred revenue due to a larger subscriber base and increase in gift subscriptions and increases in
accrued expenses as a result of our growing operations.
Investing activities: Net cash used in investing activities increased by $52.6 million in 2006 as compared
to 2005. The increase was primarily attributable to increased purchases of titles for our DVD library to support
our larger subscriber base and increased purchases of property and equipment to support our growing operations
Net cash used in investing activities increased by $67.0 million in 2005 as compared to 2004. The increase
was primarily because cash used in investing activities in 2004 included net proceeds of $45.0 million from the
sale of our short-term investments. Excluding the impact of the net proceeds from the sale of our short-term
investments, cash used in investing activities increased by $22.0 million, primarily due to increased purchases of
titles for our DVD library to support our larger subscriber base and increased purchases of property and
equipment to support our growing operations in 2005 as compared to 2004.
Financing activities: Net cash provided by financing activities increased by $112.9 million in 2006 as
compared to 2005 primarily due to the proceeds of $101.1 million from the secondary public offering of our
common stock in May 2006, as well as $13.2 million of tax benefits from stock-based compensation.
Net cash provided by financing activities increased by $7.5 million in 2005 as compared to 2004 primarily
due to an increase in proceeds from issuance of common stock under our employee stock plans.
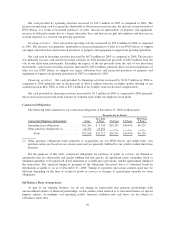
Contractual Obligations
The following table summarizes our contractual obligations at December 31, 2006 (in thousands):
Payments due by Period
Contractual Obligations (in thousands): Total
Less than
1 Year 1-3 Years 3-5 Years
More than
5 Years
Operating lease obligations ............ $51,206 $ 9,760 $20,241 $14,476 $6,729
Other purchase obligations (1) .......... 21,452 21,452 — — —
Total .......................... $72,658 $31,212 $20,241 $14,476 $6,729
(1) Other purchase obligations relate primarily to acquisitions for our DVD library and online titles. Our
purchase orders are based on our current needs and are generally fulfilled by our vendors within short time
horizons.
For the purposes of this table, contractual obligations for purchase of goods or services are defined as
agreements that are enforceable and legally binding and that specify all significant terms, including: fixed or
minimum quantities to be purchased; fixed, minimum or variable price provisions; and the approximate timing of
the transaction. The expected timing of payment of the obligations discussed above is estimated based on
information available to us as of December 31, 2006. Timing of payments and actual amounts paid may be
different depending on the time of receipt of goods or services or changes to agreed-upon amounts for some
obligations.
Off-Balance Sheet Arrangements
As part of our ongoing business, we do not engage in transactions that generate relationships with
unconsolidated entities or financial partnerships, such as entities often referred to as structured finance or special
purpose entities. Accordingly, our operating results, financial condition and cash flows are not subject to
off-balance sheet risks.
39