NetFlix 2006 Annual Report Download - page 40
Download and view the complete annual report
Please find page 40 of the 2006 NetFlix annual report below. You can navigate through the pages in the report by either clicking on the pages listed below, or by using the keyword search tool below to find specific information within the annual report.-
 1
1 -
2
-
3
-
4
-
5
-
6
-
7
-
8
-
9
-
10
-
11
-
12
-
13
-
14
-
15
-
16
-
17
-
18
-
19
-
20
-
21
-
22
-
23
-
24
-
25
-
26
-
27
-
28
-
29
-
 30
30 -
 31
31 -
 32
32 -
 33
33 -
 34
34 -
 35
35 -
 36
36 -
 37
37 -
 38
38 -
 39
39 -
 40
40 -
 41
41 -
 42
42 -
 43
43 -
 44
44 -
 45
45 -
 46
46 -
 47
47 -
 48
48 -
 49
49 -
 50
50 -
51
-
52
-
53
-
54
-
55
-
56
-
57
-
58
-
59
-
60
-
61
-
62
-
63
-
64
-
65
-
66
-
67
-
68
-
69
-
70
-
71
-
72
-
73
-
74
-
75
-
76
-
77
-
78
-
79
-
80
-
81
-
82
-
83
-
84
-
85
-
86
-
87
 |
 |

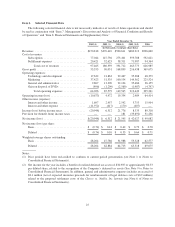
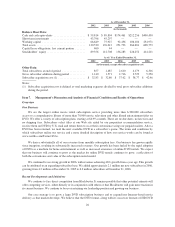
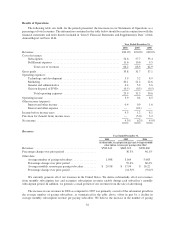
Results of Operations
The following table sets forth, for the periods presented, the line items in our Statements of Operations as a
percentage of total revenues. The information contained in the table below should be read in conjunction with the
financial statements and notes thereto included in “Item 8. Financial Statements and Supplementary Data” of this
Annual Report on Form 10-K.
Year Ended December 31,
2004 2005 2006
Revenues ........................................................... 100.0% 100.0% 100.0%
Cost of revenues:
Subscription ..................................................... 54.6 57.7 53.4
Fulfillment expenses .............................................. 11.6 10.6 9.5
Total cost of revenues ......................................... 66.2 68.3 62.9
Gross profit .......................................................... 33.8 31.7 37.1
Operating expenses:
Technology and development ....................................... 5.9 5.2 4.9
Marketing ....................................................... 20.1 21.2 22.6
General and administrative ......................................... 4.4 5.2 3.6
Gain on disposal of DVDs .......................................... (0.5) (0.3) (0.5)
Total operating expenses ....................................... 29.9 31.3 30.6
Operating income ..................................................... 3.9 0.4 6.5
Other income (expense):
Interest and other income ........................................... 0.4 0.9 1.6
Interest and other expense .......................................... — (0.1) —
Income before income taxes ............................................. 4.3 1.2 8.1
Provision for (benefit from) income taxes .................................. — (5.0) 3.2
Net income .......................................................... 4.3% 6.2% 4.9%
Revenues
Year Ended December 31,
2004 2005 2006
(in thousands, except percentages and average monthly
subscription revenue per paying subscriber)
Revenues ........................................... $500,611 $682,213 $996,660
Percentage change over prior period ...................... 36.3% 46.1%
Other data:
Average number of paying subscribers ................ 1,988 3,169 5,083
Percentage change over prior period .................. 59.4% 60.4%
Average monthly revenue per paying subscriber ......... $ 20.98 $ 17.94 $ 16.22
Percentage change over prior period .................. (14.5)% (9.6)%
We currently generate all of our revenues in the United States. We derive substantially all of our revenues
from monthly subscription fees and recognize subscription revenues ratably during each subscriber’s monthly
subscription period. In addition, we generate a small portion of our revenues from the sale of advertising.
The increase in our revenues in 2006 as compared to 2005 was primarily a result of the substantial growth in
the average number of paying subscribers, as summarized in the table above, offset in part by a decline in
average monthly subscription revenue per paying subscriber. We believe the increase in the number of paying
32