NVIDIA 2011 Annual Report Download - page 94
Download and view the complete annual report
Please find page 94 of the 2011 NVIDIA annual report below. You can navigate through the pages in the report by either clicking on the pages listed below, or by using the keyword search tool below to find specific information within the annual report.-
 1
1 -
2
-
3
-
4
-
5
-
6
-
7
-
8
-
9
-
10
-
11
-
12
-
13
-
14
-
15
-
16
-
17
-
18
-
19
-
20
-
21
-
22
-
23
-
24
-
25
-
26
-
27
-
28
-
29
-
30
-
31
-
32
-
33
-
34
-
35
-
36
-
37
-
38
-
39
-
40
-
41
-
42
-
43
-
44
-
45
-
46
-
47
-
48
-
49
-
50
-
51
-
52
-
53
-
54
-
55
-
56
-
57
-
58
-
59
-
60
-
61
-
62
-
63
-
64
-
65
-
66
-
67
-
68
-
69
-
70
-
71
-
72
-
73
-
74
-
75
-
76
-
77
-
78
-
79
-
80
-
81
-
82
-
83
-
 84
84 -
 85
85 -
 86
86 -
 87
87 -
 88
88 -
 89
89 -
 90
90 -
 91
91 -
 92
92 -
 93
93 -
 94
94 -
 95
95 -
 96
96 -
 97
97 -
 98
98 -
 99
99 -
 100
100 -
 101
101 -
 102
102 -
 103
103 -
 104
104 -
105
-
106
-
107
-
108
-
109
-
110
-
111
-
112
-
113
-
114
-
115
-
116
 |
 |

NVIDIA CORPORATION AND SUBSIDIARIES
NOTES TO THE CONSOLIDATED FINANCIAL STATEMENTS
(Continued)
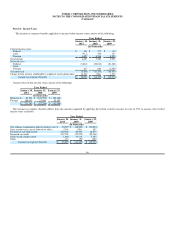
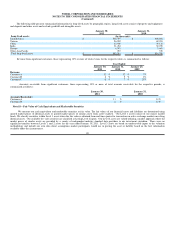
Financial assets and liabilities measured at fair value are summarized below:
Fair value measurement at reporting date using
Quoted Prices in Active Markets for
Identical Assets Significant Other Observable Inputs
January 30, 2011 (Level 1) (Level 2)
Debt securities issued by U.S. Government agencies
(1) $ 532,597 $ - $ 532,597
Corporate debt securities (2) 928,372 - 928,372
Mortgage-backed securities issued by Government-
sponsored entities (3) 145,422 - 145,422
Money market funds (4) 132,586 132,586 -
Debt securities issued by United States Treasury (5) 437,012 - 437,012
Total assets $ 2,175,989 $ 132,586 $ 2,043,403
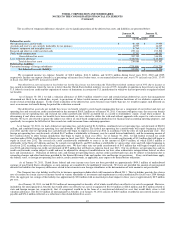
(1) Includes $70.9 million in Cash Equivalents and $461.7 million in Marketable Securities on the Consolidated Balance Sheet.
(2) Includes $107.1 million in Cash Equivalents and $821.3 million in Marketable Securities on the Consolidated Balance Sheet.
(3) Included in Marketable Securities on the Consolidated Balance Sheet.
(4) Included in Cash Equivalents on the Consolidated Balance Sheet.
(5) Includes $40.2 million in Cash Equivalents and $396.8 million in Marketable Securities on the Consolidated Balance Sheet.
During fiscal year 2011, we recovered $3.1 million of the other than temporary impairment charge previously recorded, for the International Reserve
Fund. The money market investment in the International Reserve Fund, was valued at $13.0 million as of January 31, 2010, after a $5.6 million other than
temporary impairment charge that we recorded during fiscal year 2009. We had previously, assessed the fair value of the money market funds by considering
the underlying securities held by the International Reserve Fund. Due to the inherent subjectivity and the significant judgment involved in the valuation of our
holdings of the International Reserve Fund, we have previously, classified these securities under the Level 3 fair value hierarchy. As a result of the final
payout of our invested portion, we received $16.1 million in the fourth quarter of fiscal year 2011. Consequently, we have no securities classified under Level
3.
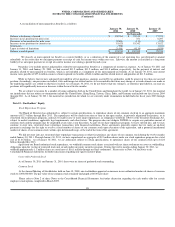
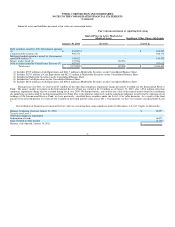
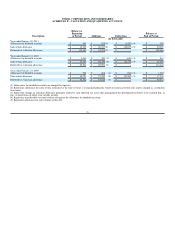
Reconciliation of financial assets measured at fair value on a recurring basis using significant unobservable inputs, or Level 3 inputs (in thousands):
Balance, beginning of period, January 31, 2010 $ 12,959
Transfer into Level 3 -
Other than temporary impairment -
Redemption of funds 16,075
Gain recorded in other income (3,116)
Balance, end of period, January 30, 2011 $ -
91