NVIDIA 2011 Annual Report Download - page 78
Download and view the complete annual report
Please find page 78 of the 2011 NVIDIA annual report below. You can navigate through the pages in the report by either clicking on the pages listed below, or by using the keyword search tool below to find specific information within the annual report.-
 1
1 -
2
-
3
-
4
-
5
-
6
-
7
-
8
-
9
-
10
-
11
-
12
-
13
-
14
-
15
-
16
-
17
-
18
-
19
-
20
-
21
-
22
-
23
-
24
-
25
-
26
-
27
-
28
-
29
-
30
-
31
-
32
-
33
-
34
-
35
-
36
-
37
-
38
-
39
-
40
-
41
-
42
-
43
-
44
-
45
-
46
-
47
-
48
-
49
-
50
-
51
-
52
-
53
-
54
-
55
-
56
-
57
-
58
-
59
-
60
-
61
-
62
-
63
-
64
-
65
-
66
-
67
-
 68
68 -
 69
69 -
 70
70 -
 71
71 -
 72
72 -
 73
73 -
 74
74 -
 75
75 -
 76
76 -
 77
77 -
 78
78 -
 79
79 -
 80
80 -
 81
81 -
 82
82 -
 83
83 -
 84
84 -
 85
85 -
 86
86 -
 87
87 -
 88
88 -
89
-
90
-
91
-
92
-
93
-
94
-
95
-
96
-
97
-
98
-
99
-
100
-
101
-
102
-
103
-
104
-
105
-
106
-
107
-
108
-
109
-
110
-
111
-
112
-
113
-
114
-
115
-
116
 |
 |

NVIDIA CORPORATION AND SUBSIDIARIES
NOTES TO THE CONSOLIDATED FINANCIAL STATEMENTS
(Continued)
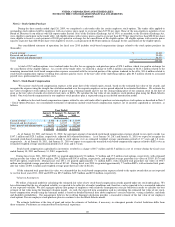
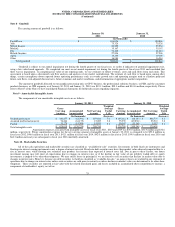
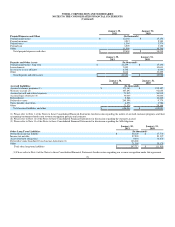
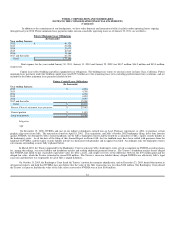
Note 8 - Goodwill
The carrying amount of goodwill is as follows:
January 30,
2011 January 31,
2010
(In thousands)
PortalPlayer $ 104,896 $ 104,896
3dfx 75,326 75,326
Mental Images 59,252 59,252
MediaQ 35,167 35,167
ULi 31,115 31,115
Hybrid Graphics 27,906 27,906
Ageia 19,198 19,198
Other 16,984 16,984
Total goodwill $ 369,844 $ 369,844
Goodwill is subject to our annual impairment test during the fourth quarter of our fiscal year, or earlier if indicators of potential impairment exist,
using a fair value-based approach. We completed our most recent annual impairment test during the fourth quarter of fiscal year 2011 and concluded that
there was no impairment. In computing fair value of our reporting units, we use estimates of future revenues, costs and cash flows from such units. This
assessment is based upon a discounted cash flow analysis and analysis of our market capitalization. The estimate of cash flow is based upon, among other
things, certain assumptions about expected future operating performance such as revenue growth rates and operating margins used to calculate projected
future cash flows, risk-adjusted discount rates, future economic and market conditions, and determination of appropriate market comparables.
The amount of goodwill allocated to our graphics processing unit, or GPU, business, the professional solutions business, or PSB, and the consumer
products business, or CPB segments as of January 30, 2011 and January 31, 2010 was $133.1 million, $95.1 million and $141.6 million, respectively. Please
refer to Note17 of the Notes to the Consolidated Financial Statements for further discussion regarding segments.
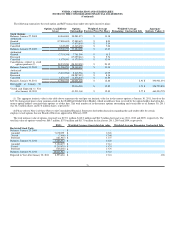
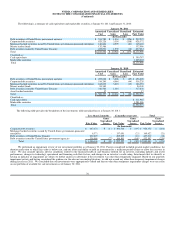
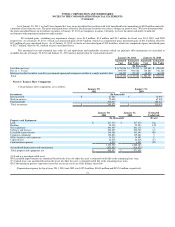
Note 9 - Amortizable Intangible Assets
The components of our amortizable intangible assets are as follows:
January 30, 2011 January 31, 2010
Gross
Carrying
Amount
Accumulated
Amortization
Net Carrying
Amount
Weighted
Average
Useful
Life
Gross
Carrying
Amount
Accumulated
Amortization
Net Carrying
Amount
Weighted
Average
Useful
Life
(In thousands) (In years) (In thousands) (In years)
Technology licenses $ 320,477 $ (62,791) $ 257,686 7.6 $ 135,112 $ (48,337) $ $86,775 6.3
Acquired intellectual property 76,264 (61,175) 15,089 3.8 75,339 (49,838 ) 25,501 3.8
Patents 31,278 (15,308) 15,970 5.3 19,347 (11,165) 8,182 5.3
Total intangible assets $ 428,019 $ (139,274) $ 288,745 $ 229,798 $ (109,340) $ 120,458
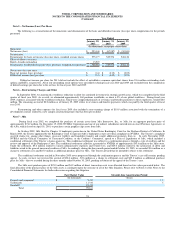
Amortization expense associated with intangible assets for fiscal years 2011, 2010 and 2009 was $30.0 million, $31.9 million and $32.6
million, respectively. Future amortization expense for the net carrying amount of intangible assets at January 30, 2011 is estimated to be $53.8 million in
fiscal year 2012, $46.6 million in fiscal year 2013, $42.1 million in fiscal year 2014, $42.0 million in fiscal year 2015, $39.9 million in fiscal year 2016 and
$64.3 million in fiscal years subsequent to fiscal year 2016 until fully amortized.
Note 10 - Marketable Securities
All of the cash equivalents and marketable securities are classified as “available-for-sale” securities. Investments in both fixed rate instruments and
floating rate interest earning instruments carry a degree of interest rate risk. Fixed rate debt securities may have their market value adversely impacted due to a
rise in interest rates, while floating rate securities may produce less income than expected if interest rates fall. Due in part to these factors, our future
investment income may fall short of expectations due to changes in interest rates or if the decline in fair value of our publicly traded debt or equity
investments is judged to be other-than-temporary. We may suffer losses in principal if we are forced to sell securities that decline in market value due to
changes in interest rates. However, because any debt securities we hold are classified as “available-for-sale,” no gains or losses are realized in our statement of
operations due to changes in interest rates unless such securities are sold prior to maturity or unless declines in market values are determined to be other-than-
temporary. These securities are reported at fair value with the related unrealized gains and losses included in accumulated other comprehensive income, a
component of stockholders’ equity, net of tax.
75