NVIDIA 2011 Annual Report Download - page 64
Download and view the complete annual report
Please find page 64 of the 2011 NVIDIA annual report below. You can navigate through the pages in the report by either clicking on the pages listed below, or by using the keyword search tool below to find specific information within the annual report.-
 1
1 -
2
-
3
-
4
-
5
-
6
-
7
-
8
-
9
-
10
-
11
-
12
-
13
-
14
-
15
-
16
-
17
-
18
-
19
-
20
-
21
-
22
-
23
-
24
-
25
-
26
-
27
-
28
-
29
-
30
-
31
-
32
-
33
-
34
-
35
-
36
-
37
-
38
-
39
-
40
-
41
-
42
-
43
-
44
-
45
-
46
-
47
-
48
-
49
-
50
-
51
-
52
-
53
-
 54
54 -
 55
55 -
 56
56 -
 57
57 -
 58
58 -
 59
59 -
 60
60 -
 61
61 -
 62
62 -
 63
63 -
 64
64 -
 65
65 -
 66
66 -
 67
67 -
 68
68 -
 69
69 -
 70
70 -
 71
71 -
 72
72 -
 73
73 -
 74
74 -
75
-
76
-
77
-
78
-
79
-
80
-
81
-
82
-
83
-
84
-
85
-
86
-
87
-
88
-
89
-
90
-
91
-
92
-
93
-
94
-
95
-
96
-
97
-
98
-
99
-
100
-
101
-
102
-
103
-
104
-
105
-
106
-
107
-
108
-
109
-
110
-
111
-
112
-
113
-
114
-
115
-
116
 |
 |

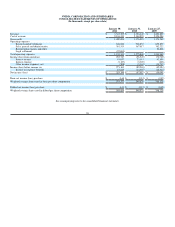
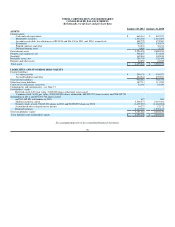
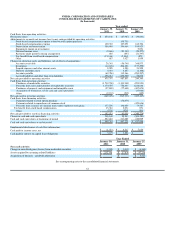
NVIDIA CORPORATION AND SUBSIDIARIES
CONSOLIDATED STATEMENTS OF CASH FLOWS
(In thousands)
Year ended
January 30,
2011
January 31,
2010
January 25,
2009
Cash flows from operating activities:
Net income (loss) $ 253,146 $ (67,987) $ (30,041)
Adjustments to reconcile net income (loss) to net cash provided by operating activities:
Stock-based compensation expense related to stock option purchase - 135,735 -
Stock-based compensation expense 100,353 107,091 162,706
Depreciation and amortization 186,989 196,664 185,023
Impairment charge on investments - - 9,891
Deferred income taxes (2,646) (21,147) (23,277)
Payments under patent licensing arrangement 685 (857) (21,797)
Tax benefit from stock based compensation (15,316) (2,034) (871)
Other 887 3,927 1,059
Changes in operating assets and liabilities, net of effects of acquisitions:
Accounts receivable 26,341 (56,741) 348,873
Inventories (14,128) 204,656 (177,295)
Prepaid expenses and other current assets 8,528 1,580 21,528
Deposits and other assets 4,331 3,857 (2,108)
Accounts payable (69,786) 119,366 (283,207)
Accrued liabilities and other long-term liabilities 196,413 (136,303) 58,876
Net cash provided by operating activities 675,797 487,807 249,360
Cash flows from investing activities:
Purchases of marketable securities (1,719,700) (1,193,948) (999,953)
Proceeds from sales and maturities of marketable securities 1,170,075 752,434 1,226,646
Purchases of property and equipment and intangible assets (97,890) (77,601) (407,670)
Acquisition of businesses, net of cash and cash equivalents - - (27,948)
Other (2,163) (218) (442)
Net cash used in investing activities (649,678) (519,333) (209,367)
Cash flows from financing activities:
Payments related to stock option purchase - (78,075) -
Payments related to repurchases of common stock - - (423,636)
Proceeds from issuance of common stock under employee stock plans 177,276 138,029 73,547
Tax benefit from stock based compensation 15,316 2,034 871
Other (571) (929) (56)
Net cash provided by (used in) financing activities 192,021 61,059 (349,274)
Change in cash and cash equivalents 218,140 29,533 (309,281)
Cash and cash equivalents at beginning of period 447,221 417,688 726,969
Cash and cash equivalents at end of period $ 665,361 $ 447,221 $ 417,688
Supplemental disclosures of cash flow information:
Cash paid for income taxes, net $ (1,071) $ 4,217 $ 7,620
Cash paid for interest on capital lease obligations $ 3,127 $ 3,256 $ -
Year Ended
January 30,
2011 January 31,
2010 January 25,
2009
Non-cash activities:
Change in unrealized gains (losses) from marketable securities $ (1,899) $ 8,305 $ (6,360)
Assets acquired by assuming related liabilities $ 252,796 $ 37,830 $ 47,236
Acquisition of business - goodwill adjustment $ - $ - $ 3,411
See accompanying notes to the consolidated financial statements.
61