NVIDIA 2011 Annual Report Download - page 75
Download and view the complete annual report
Please find page 75 of the 2011 NVIDIA annual report below. You can navigate through the pages in the report by either clicking on the pages listed below, or by using the keyword search tool below to find specific information within the annual report.-
 1
1 -
2
-
3
-
4
-
5
-
6
-
7
-
8
-
9
-
10
-
11
-
12
-
13
-
14
-
15
-
16
-
17
-
18
-
19
-
20
-
21
-
22
-
23
-
24
-
25
-
26
-
27
-
28
-
29
-
30
-
31
-
32
-
33
-
34
-
35
-
36
-
37
-
38
-
39
-
40
-
41
-
42
-
43
-
44
-
45
-
46
-
47
-
48
-
49
-
50
-
51
-
52
-
53
-
54
-
55
-
56
-
57
-
58
-
59
-
60
-
61
-
62
-
63
-
64
-
 65
65 -
 66
66 -
 67
67 -
 68
68 -
 69
69 -
 70
70 -
 71
71 -
 72
72 -
 73
73 -
 74
74 -
 75
75 -
 76
76 -
 77
77 -
 78
78 -
 79
79 -
 80
80 -
 81
81 -
 82
82 -
 83
83 -
 84
84 -
 85
85 -
86
-
87
-
88
-
89
-
90
-
91
-
92
-
93
-
94
-
95
-
96
-
97
-
98
-
99
-
100
-
101
-
102
-
103
-
104
-
105
-
106
-
107
-
108
-
109
-
110
-
111
-
112
-
113
-
114
-
115
-
116
 |
 |

NVIDIA CORPORATION AND SUBSIDIARIES
NOTES TO THE CONSOLIDATED FINANCIAL STATEMENTS
(Continued)
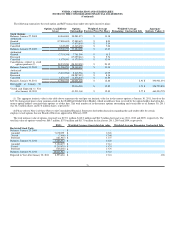
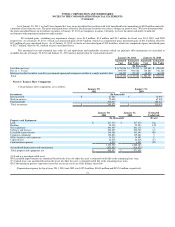
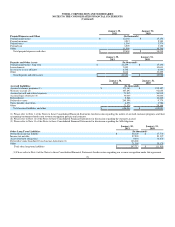
The following summarizes the stock option and RSU transactions under our equity incentive plans:
Options Available for
Grant Options
Outstanding Weighted Average
Exercise Price Per Share Weighted Average
Remaining Contractual Life Aggregate
Intrinsic Value (1)
Stock Options:
Balances, January 27, 2008 44,044,004 90,581,073 $ 13.18
Authorized - - -
Granted (17,888,695) 17,888,695 $ 8.03
Exercised - (7,670,038) $ 3.14
Cancelled 3,345,450 (3,345,450) $ 7.66
Balances, January 25, 2009 29,500,759 97,454,280 $ 13.83
Authorized - - -
Granted (7,701,396) 7,701,396 $ 11.5
Exercised - (17,099,663) $ 5.74
Cancelled 1,175,541 (1,175,541) $ 12.90
Cancellations related to stock
options purchase (2) 28,532,050 (28,532,050) $ 23.35
Balances, January 31, 2010 51,506,954 58,348,422 $ 11.30
Authorized - - -
Granted (5,818,966) 5,818,966 $ 13.79
Exercised - (18,287,483) $ 8.16
Cancelled 1,878,447 (1,878,447) $ 12.56
Balances, January 30, 2011 47,566,435 44,001,458 $ 12.88 2.91 $ 490,941,491
Exercisable at January 30,
2011 29,016,290 $ 12.85 1.71 $ 326,752,839
Vested and Expected to Vest
after January 30, 2011 41,511,160 $ 12.89 2.77 $ 463,094,795
(1) The aggregate intrinsic value in the table above represents the total pre-tax intrinsic value for in-the-money options at January 30, 2011, based on the
$23.76 closing stock price of our common stock on the NASDAQ Global Select Market, which would have been received by the option holders had all in-the-
money option holders exercised their options as of that date. The total number of in-the-money options outstanding and exercisable as of January 30, 2011
was 42.7 million shares and 27.8 million shares, respectively.
(2) Please refer to Note 2 of these Notes to the Consolidated Financial Statements for further discussion regarding the cash tender offer for certain
employee stock options that our Board of Directors approved in February 2009.
The total intrinsic value of options exercised was $139.1 million, $140.3 million and $84.9 million for fiscal years 2011, 2010 and 2009, respectively. The
total fair value of options vested was $60.7 million, $37.0 million and $117.0 million for fiscal years 2011, 2010 and 2009, respectively.
RSUs Weighted Average Grant-date fair value Weighted Average Remaining Contractual Life
Restricted Stock Units:
Balances, January 25, 2009 - $ -
Awarded 7,672,899 $ 12.26
Vested (2,400) $ 12.40
Forfeited (181,987) $ 11.37
Balances, January 31, 2010 7,488,512 $ 12.28
Awarded 7,104,693 $ 13.61
Vested (3,215,633) $ 11.74
Forfeited (765,658) $ 13.76
Balances, January 30, 2011 10,611,914 $ 13.23
Expected to Vest after January 30, 2011 8,593,484 $ 13.24 1.96
72