NVIDIA 2011 Annual Report Download - page 47
Download and view the complete annual report
Please find page 47 of the 2011 NVIDIA annual report below. You can navigate through the pages in the report by either clicking on the pages listed below, or by using the keyword search tool below to find specific information within the annual report.-
 1
1 -
2
-
3
-
4
-
5
-
6
-
7
-
8
-
9
-
10
-
11
-
12
-
13
-
14
-
15
-
16
-
17
-
18
-
19
-
20
-
21
-
22
-
23
-
24
-
25
-
26
-
27
-
28
-
29
-
30
-
31
-
32
-
33
-
34
-
35
-
36
-
 37
37 -
 38
38 -
 39
39 -
 40
40 -
 41
41 -
 42
42 -
 43
43 -
 44
44 -
 45
45 -
 46
46 -
 47
47 -
 48
48 -
 49
49 -
 50
50 -
 51
51 -
 52
52 -
 53
53 -
 54
54 -
 55
55 -
 56
56 -
 57
57 -
58
-
59
-
60
-
61
-
62
-
63
-
64
-
65
-
66
-
67
-
68
-
69
-
70
-
71
-
72
-
73
-
74
-
75
-
76
-
77
-
78
-
79
-
80
-
81
-
82
-
83
-
84
-
85
-
86
-
87
-
88
-
89
-
90
-
91
-
92
-
93
-
94
-
95
-
96
-
97
-
98
-
99
-
100
-
101
-
102
-
103
-
104
-
105
-
106
-
107
-
108
-
109
-
110
-
111
-
112
-
113
-
114
-
115
-
116
 |
 |

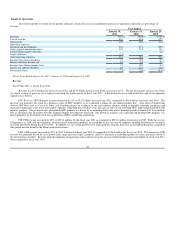
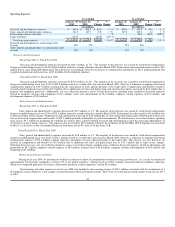
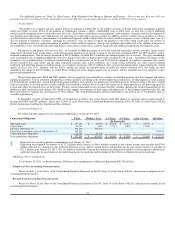
Operating Expenses
Year Ended Year Ended
January 30,
2011
January 31,
2010
$
Change
%
Change
January 31,
2010
January 25,
2009
$
Change
%
Change
(In millions) (In millions)
Research and development expenses $ 848.8 $ 908.9 $ (60.1) (7 %) $ 908.9 $ 855.9 $ 53.0 6 %
Sales, general and administrative expenses 361.5 367.0 (5.5) (1%) 367.0 362.2 4.8 1 %
Restructuring charges and other - - - - % - 26.9 (26.9) (100%)
Legal settlement (57.0) - (57.0) (100 %) - - - - %
Total operating expenses $ 1,153.3 $ 1,275.9 $(122.6) (10%) $ 1,275.9 $ 1,245.0 $ 30.9 2.5 %
Research and development as a percentage of net
revenue 24% 27% 27% 25%
Sales, general and administrative as a percentage of net
revenue 10% 11% 11% 11%
Research and Development
Fiscal Year 2011 vs. Fiscal Year 2010
Research and development expenses decreased by $60.1 million, or 7%. The majority of the decrease was caused by stock-based compensation
charges recorded during fiscal year 2010 of $90.5 million related to a tender offer that closed in March 2009. Depreciation and amortization decreased by $8.9
million due to assets being fully depreciated. These decreases were partially offset by an increase in compensation and benefits of $23.5 million primarily due
to growth in headcount and an increase of $7.6 million for development expenses.
Fiscal Year 2010 vs. Fiscal Year 2009
Research and development expenses increased by $53.0 million, or 6%. The majority of the increase was caused by stock-based compensation
charges recorded during fiscal year 2010 of $90.5 million related to a tender offer that closed in March 2009, offset by a reduction in ongoing stock-based
compensation expense of $36.7 million resulting from the cancellation of stock options pursuant to the tender offer. Compensation and benefits related to
research and development increased by $11.9 million due to additional new hires and depreciation and amortization expense increased by $4.2 million due to
property and equipment purchases. Additionally, our cost reduction initiatives across several discretionary spending areas resulted in decreased expenses
related to computer software and equipment of $7.7 million, travel and entertainment of $5.4 million, employee related expenses of $3.5 million, and
development expenses of $2.8 million.
Sales, General and Administrative
Fiscal Year 2011 vs. Fiscal Year 2010
Sales, general and administrative expenses decreased by $5.5 million, or 1%. The majority of the decrease was caused by stock-based compensation
charges recorded during fiscal year 2010 of $38.3 million related to a tender offer that closed in March 2009. Professional fees decreased by $10.6 million due
to decreased legal service charges. Depreciation and amortization decreased by $4.2 million due to assets being fully depreciated. Offsetting these decreases
was an increase in compensation and benefits of $28.1 million primarily attributable to growth in headcount. We had increases across discretionary spending
areas such as $5.7 million for marketing, $3.2 million for contract labor, and $2.9 million for travel and entertainment to meet the increasing opportunities of
our business as the economy recovers. Our expenses also increased by $15.0 million related to the settlement of the NVIDIA GPU Litigation case described
in Note 13 of the Notes to the Consolidated Financial Statements in Part IV, Item 15 of this Form 10-K.
Fiscal Year 2010 vs. Fiscal Year 2009
Sales, general and administrative expenses increased by $4.8 million, or 1%. The majority of the increase was caused by stock-based compensation
charges recorded during fiscal year 2010 of $38.3 million related to a tender offer that closed in March 2009, offset by a reduction in ongoing stock-based
compensation expense of $19.1 million resulting from the cancellation of stock options pursuant to the tender offer. The increase was also driven by an
increase in compensation and benefits by $8.4 million due to additional new hires and professional fees by $11.3 million due to legal service charges.
Offsetting these increases, our cost reduction initiatives across several discretionary spending areas resulted in decreased expenses related to advertising and
promotions of $9.3 million, employee related expenses of $8.0 million, contract labor of $6.6 million, computer software and equipment of $6.5 million, and
marketing of $5.4 million.
Restructuring Charges and Other
During fiscal year 2009, we announced a workforce reduction to allow for continued investment in strategic growth areas. As a result, we eliminated
approximately 360 positions worldwide, or about 6.5% of our global workforce. During fiscal year 2009, expenses associated with the workforce reduction,
which were comprised primarily of severance and benefits payments to these employees, totaled $8.0 million.
Restructuring and other expenses in fiscal year 2009 also included a non-recurring charge of $18.9 million associated with the termination of a
development contract related to a new campus construction project that has been put on hold. There were no restructuring related charges in fiscal years 2011
or 2010.
45