NVIDIA 2011 Annual Report Download - page 83
Download and view the complete annual report
Please find page 83 of the 2011 NVIDIA annual report below. You can navigate through the pages in the report by either clicking on the pages listed below, or by using the keyword search tool below to find specific information within the annual report.-
 1
1 -
2
-
3
-
4
-
5
-
6
-
7
-
8
-
9
-
10
-
11
-
12
-
13
-
14
-
15
-
16
-
17
-
18
-
19
-
20
-
21
-
22
-
23
-
24
-
25
-
26
-
27
-
28
-
29
-
30
-
31
-
32
-
33
-
34
-
35
-
36
-
37
-
38
-
39
-
40
-
41
-
42
-
43
-
44
-
45
-
46
-
47
-
48
-
49
-
50
-
51
-
52
-
53
-
54
-
55
-
56
-
57
-
58
-
59
-
60
-
61
-
62
-
63
-
64
-
65
-
66
-
67
-
68
-
69
-
70
-
71
-
72
-
 73
73 -
 74
74 -
 75
75 -
 76
76 -
 77
77 -
 78
78 -
 79
79 -
 80
80 -
 81
81 -
 82
82 -
 83
83 -
 84
84 -
 85
85 -
 86
86 -
 87
87 -
 88
88 -
 89
89 -
 90
90 -
 91
91 -
 92
92 -
 93
93 -
94
-
95
-
96
-
97
-
98
-
99
-
100
-
101
-
102
-
103
-
104
-
105
-
106
-
107
-
108
-
109
-
110
-
111
-
112
-
113
-
114
-
115
-
116
 |
 |

NVIDIA CORPORATION AND SUBSIDIARIES
NOTES TO THE CONSOLIDATED FINANCIAL STATEMENTS
(Continued)
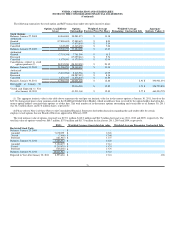
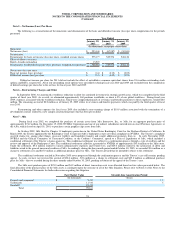
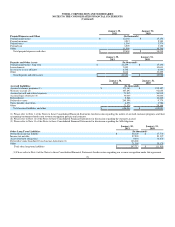
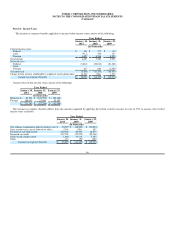
Accrual for estimated product returns and product warranty liabilities
We record a reduction to revenue for estimated product returns at the time revenue is recognized primarily based on historical return rates. Cost of
revenue includes the estimated cost of product warranties that are calculated at the point of revenue recognition. Under limited circumstances, we may offer
an extended limited warranty to customers for certain products. Additionally, we accrue for known warranty and indemnification issues if a loss is probable
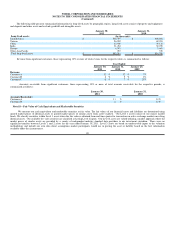
and can be reasonably estimated. The estimated product returns and estimated product warranty liabilities for fiscal years 2011, 2010 and 2009 are as follows:
January 30,
2011 January 31,
2010 January 25,
2009
(In thousands)
Balance at beginning of period $ 92,655 $ 150,631 $ 5,708
Additions (1) 194,108 170,715 202,698
Deductions (2) (178,867) (228,691) (57,775)
Balance at end of period $ 107,896 $ 92,655 $ 150,631
(1) Includes $186.2 million, $164.5 million and $196.0 million for fiscal years 2011, 2010 and 2009, respectively, for incremental repair and replacement
costs from a weak die/packaging material set.
(2) Includes $149.8 million, $196.0 million and $37.5 million for fiscal years 2011, 2010 and 2009, respectively, in payments related to the warranty
accrual associated with incremental repair and replacement costs from a weak die/packaging material set.
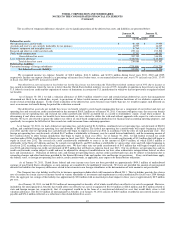
In connection with certain agreements that we have executed in the past, we have at times provided indemnities to cover the indemnified party for
matters such as tax, product and employee liabilities. We have also on occasion included intellectual property indemnification provisions in our technology
related agreements with third parties. Maximum potential future payments cannot be estimated because many of these agreements do not have a maximum
stated liability. As such, we have not recorded any liability in our Consolidated Financial Statements for such indemnifications.
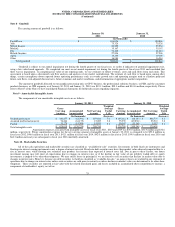
Note 13 - Financial Arrangements, Commitments and Contingencies
Inventory Purchase Obligations
At January 30, 2011 and January 31, 2010, we had outstanding inventory purchase obligations totaling $546.4 million and $462.0 million,
respectively.
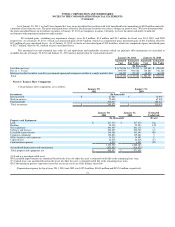
Capital Purchase Obligations
At January 30, 2011 and January 31, 2010, we had outstanding capital purchase obligations totaling $31.8 million and $25.2 million, respectively.
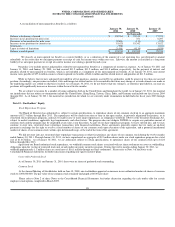
Lease Obligations
Our headquarters complex is located in Santa Clara, California and includes eight buildings that are leased properties. The lease agreements for four
of the eight leased properties expire in fiscal year 2020 and include four five-year renewals at our option; one leased property expires in fiscal year 2013 with
an option to extend for one year; one leased property expires in fiscal year 2012 with an option to extend for three years; one lease property expires in fiscal
year 2020 with two five year renewals at our option and the remaining leased building expires in fiscal year 2015 with an option to extend for three
years. Future minimum lease payments related to headquarter operating leases total $121.4 million over the remaining terms of the leases, including
predetermined rent escalations, and are included in the future minimum lease payment schedule below.
80