NVIDIA 2011 Annual Report Download - page 44
Download and view the complete annual report
Please find page 44 of the 2011 NVIDIA annual report below. You can navigate through the pages in the report by either clicking on the pages listed below, or by using the keyword search tool below to find specific information within the annual report.-
 1
1 -
2
-
3
-
4
-
5
-
6
-
7
-
8
-
9
-
10
-
11
-
12
-
13
-
14
-
15
-
16
-
17
-
18
-
19
-
20
-
21
-
22
-
23
-
24
-
25
-
26
-
27
-
28
-
29
-
30
-
31
-
32
-
33
-
 34
34 -
 35
35 -
 36
36 -
 37
37 -
 38
38 -
 39
39 -
 40
40 -
 41
41 -
 42
42 -
 43
43 -
 44
44 -
 45
45 -
 46
46 -
 47
47 -
 48
48 -
 49
49 -
 50
50 -
 51
51 -
 52
52 -
 53
53 -
 54
54 -
55
-
56
-
57
-
58
-
59
-
60
-
61
-
62
-
63
-
64
-
65
-
66
-
67
-
68
-
69
-
70
-
71
-
72
-
73
-
74
-
75
-
76
-
77
-
78
-
79
-
80
-
81
-
82
-
83
-
84
-
85
-
86
-
87
-
88
-
89
-
90
-
91
-
92
-
93
-
94
-
95
-
96
-
97
-
98
-
99
-
100
-
101
-
102
-
103
-
104
-
105
-
106
-
107
-
108
-
109
-
110
-
111
-
112
-
113
-
114
-
115
-
116
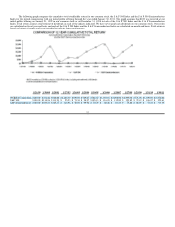
 |
 |

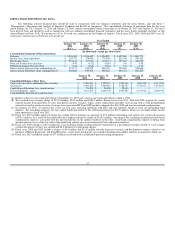
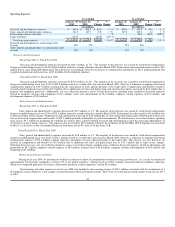
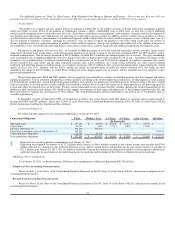
Results of Operations
The following table sets forth, for the periods indicated, certain items in our consolidated statements of operations expressed as a percentage of
revenue.
Year Ended
January 30,
2011 January 31,
2010 January 25,
2009
Revenue 100.0% 100.0% 100.0%
Cost of revenue 60.2 64.6 65.7
Gross profit 39.8 35.4 34.3
Operating expenses:
Research and development 24.0 27.3 25.0
Sales, general and administrative 10.2 11.0 10.6
Restructuring charges and other - - 0.8
Legal settlement (1.6) - -
Total operating expenses 32.6 38.3 36.4
Income (loss) from operations 7.2 (2.9) (2.1)
Interest and other income, net 0.4 0.5 0.8
Income (loss) before income taxes 7.6 (2.4) (1.3)
Income tax expense (benefit) 0.5 (0.4) (0.4)
Net income (loss) 7.1% (2.0)% (0.9)%
Fiscal Years Ended January 30, 2011, January 31, 2010 and January 25, 2009
Revenue
Fiscal Year 2011 vs. Fiscal Year 2010
Revenue was $3.54 billion for the fiscal year 2011 and $3.33 billion for fiscal year 2010, an increase of 7%. For the first quarter of fiscal year 2012,
we expect revenue to grow by six to eight percent from the fourth quarter of fiscal year 2011. A discussion of our revenue results for each of our operating
segments is as follows:
GPU Business. GPU Business revenue decreased by 5% to $2.52 billion for fiscal year 2011 compared to $2.66 billion for fiscal year 2010. The
decrease was primarily the result of a decline in sales of MCP products as we continued to phase out our chipset product line. Also sales of mainstream
desktop GPU decreased as a result of lower unit shipments driven by weakness in our end customer markets related to unstable economic conditions and
increased competition in the lower-end market segments. Offsetting these declines were increases in sales of our notebook GPU, high-end desktop GPU and
memory products. The growth in sales of notebook GPU products was driven by a continuing shift in the market demand towards notebook PCs from desktop
PCs as reported in the December 2010 PC Graphics Report from Mercury Research. The growth in memory sales and high-end desktop GPU products was
driven primarily by the launch of our new generation of GPUs with Fermi architecture.
PSB. PSB revenue increased by 60% to $818.6 million for the fiscal year 2011 as compared to $510.0 million for fiscal year 2010. Both the average
selling price, or ASP, and unit shipments of professional workstation products increased due to the recovery of corporate spending following the economic
recession that began during fiscal year 2009. In addition, we saw strong growth in our Tesla products from the prior year as our high performance computing
line gained traction fueled by the Fermi architecture release.
CPB. CPB revenue increased by 27% to $197.6 million for fiscal year 2011 as compared to $156.0 million for fiscal year 2010. This increase in CPB
revenue was primarily driven by sales growth from ramp up in our Tegra 2 products, offset by decreases in embedded product revenues primarily related to
the entertainment markets. Revenue from development arrangements and royalties from game console-related products increased slightly in fiscal year 2011
when compared to fiscal year 2010.
42