NVIDIA 2011 Annual Report Download - page 53
Download and view the complete annual report
Please find page 53 of the 2011 NVIDIA annual report below. You can navigate through the pages in the report by either clicking on the pages listed below, or by using the keyword search tool below to find specific information within the annual report.-
 1
1 -
2
-
3
-
4
-
5
-
6
-
7
-
8
-
9
-
10
-
11
-
12
-
13
-
14
-
15
-
16
-
17
-
18
-
19
-
20
-
21
-
22
-
23
-
24
-
25
-
26
-
27
-
28
-
29
-
30
-
31
-
32
-
33
-
34
-
35
-
36
-
37
-
38
-
39
-
40
-
41
-
42
-
 43
43 -
 44
44 -
 45
45 -
 46
46 -
 47
47 -
 48
48 -
 49
49 -
 50
50 -
 51
51 -
 52
52 -
 53
53 -
 54
54 -
 55
55 -
 56
56 -
 57
57 -
 58
58 -
 59
59 -
 60
60 -
 61
61 -
 62
62 -
 63
63 -
64
-
65
-
66
-
67
-
68
-
69
-
70
-
71
-
72
-
73
-
74
-
75
-
76
-
77
-
78
-
79
-
80
-
81
-
82
-
83
-
84
-
85
-
86
-
87
-
88
-
89
-
90
-
91
-
92
-
93
-
94
-
95
-
96
-
97
-
98
-
99
-
100
-
101
-
102
-
103
-
104
-
105
-
106
-
107
-
108
-
109
-
110
-
111
-
112
-
113
-
114
-
115
-
116
 |
 |

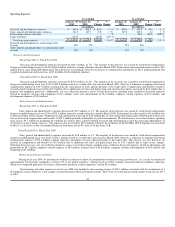
For additional factors see “Item 1A. Risk Factors - Risks Related to Our Business, Industry and Partners - Our revenue may fluctuate while our
operating expenses are relatively fixed, which makes our results difficult to predict and could cause our results to fall short of expectations.”
Product Defect
Our products are complex and may contain defects or experience failures due to any number of issues in design, fabrication, packaging, materials
and/or use within a system. If any of our products or technologies contains a defect, compatibility issue or other error, we may have to invest additional
research and development efforts to find and correct the issue. Such efforts could divert our management’s and engineers’ attention from the development of
new products and technologies and could increase our operating costs and reduce our gross margin. In addition, an error or defect in new products or releases
or related software drivers after commencement of commercial shipments could result in failure to achieve market acceptance or loss of design wins. Also, we
may be required to reimburse customers, including for customers’ costs to repair or replace the products in the field, which could cause our revenue to
decline. A product recall or a significant number of product returns could be expensive, damage our reputation and could result in the shifting of business to
our competitors. Costs associated with correcting defects, errors, bugs or other issues could be significant and could materially harm our financial results.
During the second quarter of fiscal year 2011, we recorded an additional charge to cover the estimated remaining customer warranty, repair, return,
replacement and other costs arising from a weak die/packaging material set in certain versions of our previous generation MCP and GPU products used in
notebook configurations. The net charge amounted to $193.9 million, of which $181.2 million was charged against cost of revenue. The extra remediation
costs are primarily due to additional platforms from late failing systems that we had not previously considered to be at risk. Included in the charge are the
estimated costs of implementing a settlement reached during the second quarter of fiscal year 2011 with the plaintiffs of a putative consumer class action
lawsuit related to this same matter and the other estimated consumer class action settlement. As a result of this settlement, the other related estimated
settlement, and offsetting insurance reimbursements, we recorded a net charge of $12.7 million to sales, general and administrative expense during the second
quarter of fiscal year 2011. Together with the $282.0 million net charge we had previously recorded for related estimated costs, this brings the total
cumulative net charge to $475.9 million, of which $466.4 million has been charged against cost of revenue and the remainder has been charged to sales,
general and administrative.
The previous generation MCP and GPU products that are impacted were included in a number of notebook products that were shipped and sold in
significant quantities. Certain notebook configurations of these products are failing in the field at higher than normal rates. Testing suggests a weak material
set of die/package combination, system thermal management designs, and customer use patterns are contributing factors for these failures. We have worked
with our customers to develop and have made available for download a software driver to cause the system fan to begin operation at the powering up of the
system and reduce the thermal stress on these chips. We have also recommended to our customers that they consider changing the thermal management of the
products in their notebook system designs. We intend to fully support our customers in their repair and replacement of these impacted products that fail, and
their other efforts to mitigate the consequences of these failures. The weak die/packaging material combination is not used in any of our products that are
currently in production.
In September, October and November 2008, several putative securities class action lawsuits were filed against us, asserting various claims related to
the impacted MCP and GPU products. Please refer to Note 13 of the Notes to the Consolidated Financial Statements in Part IV, Item 15 of this Form 10-K for
further information regarding this litigation and the settlement.
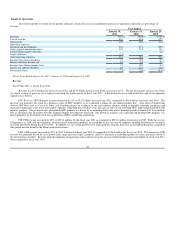
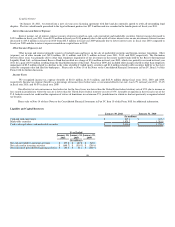
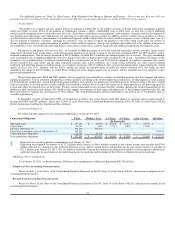
Contractual Obligations
The following table summarizes our contractual obligations as of January 30, 2011:
Contractual Obligations Total Within 1 Year 2-3 Years 4-5 Years After 5 Years All Other
(In thousands)
Operating leases $ 177,166 $ 46,329 $ 50,969 $ 34,115 $ 45,753 $ -
Capital lease 40,126 4,654 9,714 9,849 15,909 -
Purchase obligations (1) 546,360 546,360 -
Uncertain tax positions, interest and penalties (2) 132,211 132,211
Capital purchase obligations 31,736 31,736
Total contractual obligations $ 927,599 $ 629,079 $ 60,683 $ 43,964 $ 61,662 $ 132,211
(1) Represents our inventory purchase commitments as of January 30, 2011.
(2) Represents unrecognized tax benefits of $132.2 million which consists of $46.4 million recorded in non-current income taxes payable and $74.6
million reflected as a reduction to the related deferred tax assets, and the related interest and penalties on the non-current income tax payable of
$11.2 million as of January 30, 2011. We are unable to reasonably estimate the timing of any potential tax liability or interest/penalty payments in
individual years due to uncertainties in the underlying income tax positions and the timing of the effective settlement of such tax positions.
Off-Balance Sheet Arrangements
As of January 30, 2011, we had no material off-balance sheet arrangements as defined in Regulation S-K 303(a)(4)(ii).
Adoption of New Accounting Pronouncements
Please see Note 1 of the Notes to the Consolidated Financial Statements in Part IV, Item 15 of this Form 10-K for a discussion of adoption of new
accounting pronouncements.
Recently Issued Accounting Pronouncements
Please see Note 1 of the Notes to the Consolidated Financial Statements in Part IV, Item 15 of this Form 10-K for a discussion of recently issued
accounting pronouncements.
51