NVIDIA 2011 Annual Report Download - page 70
Download and view the complete annual report
Please find page 70 of the 2011 NVIDIA annual report below. You can navigate through the pages in the report by either clicking on the pages listed below, or by using the keyword search tool below to find specific information within the annual report.-
 1
1 -
2
-
3
-
4
-
5
-
6
-
7
-
8
-
9
-
10
-
11
-
12
-
13
-
14
-
15
-
16
-
17
-
18
-
19
-
20
-
21
-
22
-
23
-
24
-
25
-
26
-
27
-
28
-
29
-
30
-
31
-
32
-
33
-
34
-
35
-
36
-
37
-
38
-
39
-
40
-
41
-
42
-
43
-
44
-
45
-
46
-
47
-
48
-
49
-
50
-
51
-
52
-
53
-
54
-
55
-
56
-
57
-
58
-
59
-
 60
60 -
 61
61 -
 62
62 -
 63
63 -
 64
64 -
 65
65 -
 66
66 -
 67
67 -
 68
68 -
 69
69 -
 70
70 -
 71
71 -
 72
72 -
 73
73 -
 74
74 -
 75
75 -
 76
76 -
 77
77 -
 78
78 -
 79
79 -
 80
80 -
81
-
82
-
83
-
84
-
85
-
86
-
87
-
88
-
89
-
90
-
91
-
92
-
93
-
94
-
95
-
96
-
97
-
98
-
99
-
100
-
101
-
102
-
103
-
104
-
105
-
106
-
107
-
108
-
109
-
110
-
111
-
112
-
113
-
114
-
115
-
116
 |
 |

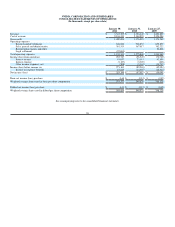
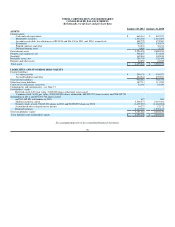
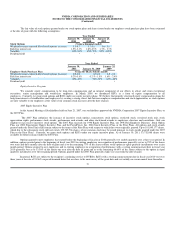
NVIDIA CORPORATION AND SUBSIDIARIES
NOTES TO THE CONSOLIDATED FINANCIAL STATEMENTS
(Continued)
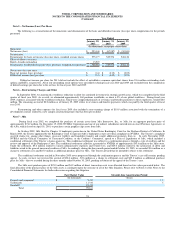
Fair Value of Financial Instruments
The carrying value of cash, cash equivalents, accounts receivable, accounts payable and accrued liabilities approximate their fair values due to their
relatively short maturities as of January 30, 2011 and January 31, 2010. Marketable securities are comprised of available-for-sale securities that are reported at
fair value with the related unrealized gains and losses included in accumulated other comprehensive income (loss), a component of stockholders’ equity, net
of tax. Fair value of the marketable securities is determined based on quoted market prices.
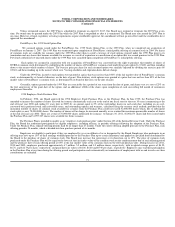
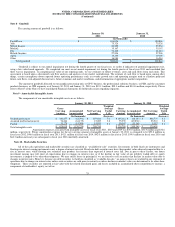
Concentration of Credit Risk
Financial instruments that potentially subject us to concentrations of credit risk consist primarily of cash equivalents, marketable securities and
accounts receivable. Our investment policy requires the purchase of top-tier investment grade securities, the diversification of asset type and includes certain
limits on our portfolio duration. All marketable securities are held in our name, managed by several investment managers and held by one major financial
institution under a custodial arrangement. Accounts receivable from significant customers, those representing 10% or more of total accounts receivable
aggregated approximately 11% of our accounts receivable balance from one customer at January 30, 2011 and approximately 20% of our accounts receivable
balance from two customers at January 31, 2010. We perform ongoing credit evaluations of our customers’ financial condition and maintain an allowance for
potential credit losses. This allowance consists of an amount identified for specific customers and an amount based on overall estimated exposure. Our overall
estimated exposure excludes amounts covered by credit insurance and letters of credit.
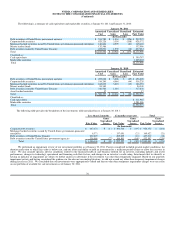
Accounts Receivable
We maintain an allowance for doubtful accounts receivable for estimated losses resulting from the inability of our customers to make required
payments. We determine this allowance, which consists of an amount identified for specific customer issues as well as an amount based on overall estimated
exposure. Factors impacting the allowance include the level of gross receivables, the financial condition of our customers and the extent to which balances are
covered by credit insurance or letters of credit.
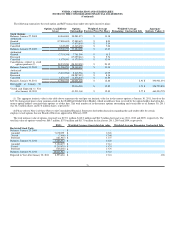
Inventories
Inventory cost is computed on an adjusted standard basis, which approximates actual cost on an average or first-in, first-out basis. Inventory costs
consist primarily of the cost of semiconductors purchased from subcontractors, including wafer fabrication, assembly, testing and packaging, manufacturing
support costs, including labor and overhead associated with such purchases, final test yield fallout, inventory provisions and shipping costs. We write down
our inventory to the lower of cost or estimated market value. Obsolete or unmarketable inventory is completely written off based upon assumptions about
future demand, future product purchase commitments, estimated manufacturing yield levels and market conditions. If actual market conditions are less
favorable than those projected by management, or if our future product purchase commitments to our suppliers exceed our forecasted future demand for such
products, additional future inventory write-downs may be required that could adversely affect our operating results. Inventory reserves once established are
not reversed until the related inventory has been sold or scrapped. If actual market conditions are more favorable than expected and we sell products that we
have previously written down, our reported gross margin would be favorably impacted.
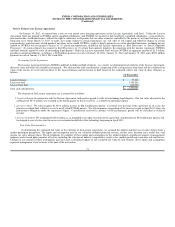
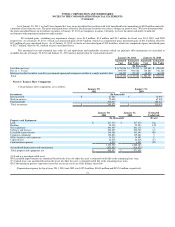
Property and Equipment
Property and equipment are stated at cost. Depreciation of property and equipment is computed using the straight-line method based on the
estimated useful lives of the assets, generally three to five years. The estimated useful lives of our buildings are up to twenty-five years. Depreciation expense
includes the amortization of assets recorded under capital leases. Leasehold improvements and assets recorded under capital leases are amortized over the
shorter of the lease term or the estimated useful life of the asset.
Goodwill
Goodwill is subject to our annual impairment test during the fourth quarter of our fiscal year, or earlier if indicators of potential impairment exist,
using a fair value-based approach. For the purposes of completing our impairment test, we perform our analysis on a reporting unit basis. We utilize a two-
step approach to test goodwill for impairment. The first step tests for possible impairment by applying a fair value-based test. Our impairment review process
compares the estimated fair value of the reporting unit in which the goodwill resides to its carrying value. In computing fair value of our reporting units, we
use estimates of future revenues, costs and cash flows from such units. The second step, if necessary, measures the amount of such impairment by applying
fair value-based tests to individual assets and liabilities.
67