NVIDIA 2011 Annual Report Download - page 92
Download and view the complete annual report
Please find page 92 of the 2011 NVIDIA annual report below. You can navigate through the pages in the report by either clicking on the pages listed below, or by using the keyword search tool below to find specific information within the annual report.-
 1
1 -
2
-
3
-
4
-
5
-
6
-
7
-
8
-
9
-
10
-
11
-
12
-
13
-
14
-
15
-
16
-
17
-
18
-
19
-
20
-
21
-
22
-
23
-
24
-
25
-
26
-
27
-
28
-
29
-
30
-
31
-
32
-
33
-
34
-
35
-
36
-
37
-
38
-
39
-
40
-
41
-
42
-
43
-
44
-
45
-
46
-
47
-
48
-
49
-
50
-
51
-
52
-
53
-
54
-
55
-
56
-
57
-
58
-
59
-
60
-
61
-
62
-
63
-
64
-
65
-
66
-
67
-
68
-
69
-
70
-
71
-
72
-
73
-
74
-
75
-
76
-
77
-
78
-
79
-
80
-
81
-
 82
82 -
 83
83 -
 84
84 -
 85
85 -
 86
86 -
 87
87 -
 88
88 -
 89
89 -
 90
90 -
 91
91 -
 92
92 -
 93
93 -
 94
94 -
 95
95 -
 96
96 -
 97
97 -
 98
98 -
 99
99 -
 100
100 -
 101
101 -
 102
102 -
103
-
104
-
105
-
106
-
107
-
108
-
109
-
110
-
111
-
112
-
113
-
114
-
115
-
116
 |
 |

NVIDIA CORPORATION AND SUBSIDIARIES
NOTES TO THE CONSOLIDATED FINANCIAL STATEMENTS
(Continued)
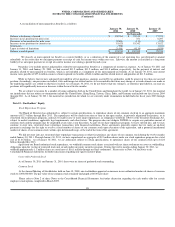
Note 16 - Employee Retirement Plans
We have a 401(k) Retirement Plan, or the 401(k) Plan, covering substantially all of our United States employees. Under the Plan, participating
employees may defer up to 100% of their pre-tax earnings, subject to the Internal Revenue Service annual contribution limits. Some of our non-US
subsidiaries have defined benefit and defined contributions plans as required by local statutory requirements. Our costs under these plans have not been
material.
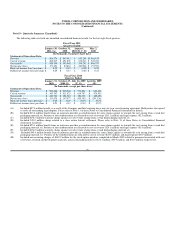
Note 17 - Segment Information
Our Chief Executive Officer, who is considered to be our chief operating decision maker, or CODM, reviews financial information presented on an
operating segment basis for purposes of making operating decisions and assessing financial performance. During the last several fiscal years, we have
operated and reported four major product-line operating segments to our CODM: the GPU business, the PSB, the MCP business, and the CPB. However,
during the first quarter of fiscal year 2011, we began reporting internally the results of our former MCP segment along with the results of our GPU segment to
reflect the way we manage the GPU business. Comparative periods presented reflect this change.
Our GPU business is comprised primarily of our GeForce discrete and chipset products which support desktop and notebook personal computers, or
PCs, plus memory products. Our PSB is comprised of our Quadro professional workstation products and other professional graphics products, including our
NVIDIA Tesla high-performance computing products. Our CPB is comprised of our Tegra mobile products which support tablets, smartphones, personal
media players, or PMPs, internet television, automotive navigation, and other similar devices. CPB also includes license, royalty, other revenue and associated
costs related to video game consoles and other digital consumer electronics devices. Original equipment manufacturers, or OEMs, original design
manufacturers, or ODMs, add-in-card manufacturers, system builders and consumer electronics companies worldwide utilize our processors as a core
component of their entertainment, business and professional solutions.
The “All Other” category includes non-recurring charges and benefits that we do not allocate to our operating segments as these items are not included
in the segment operating performance measures evaluated by our CODM. During the year ended January 30, 2011, we entered into a new six-year cross
licensing agreement with Intel and also mutually agreed to settle all outstanding legal disputes. For accounting purposes, the fair valued benefit prescribed to
the settlement portion was $57.0 million and was considered a non-recurring benefit for the fiscal year 2011. Please refer to Note 4 of the Notes to the
Consolidated Financial Statements for further discussion regarding the patent cross license agreement with Intel. Non-recurring charges related to our cash
tender offer to purchase certain employee stock options were $140.2 million for the year ended January 31, 2010. Please refer to Note 2 of the Notes to the
Consolidated Financial Statements for further discussion regarding the cash tender offer. During the year ended January 25, 2009, we recorded a non-
recurring charge of $26.9 million for restructuring and other charges associated with the termination of a development contract related to a new campus
construction project we had put on hold. Please refer to Note 6 of the Notes to the Consolidated Financial Statements for further discussion regarding the
restructuring and other charges.
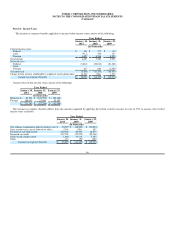
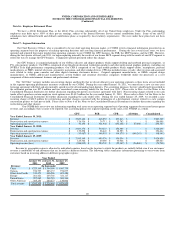
Our CODM does not review any information regarding total assets on an operating segment basis. Operating segments do not record intersegment
revenue, and, accordingly, there is none to be reported. The accounting policies for segment reporting are the same as for NVIDIA as a whole.
GPU PSB CPB All Other Consolidated
Year Ended January 30, 2011:
Revenue $ 2,527,144 $ 818,552 $ 197,613 $ - $ 3,543,309
Depreciation and amortization expense $ 126,536 $ 26,711 $ 33,742 $ - $ 186,989
Operating income (loss) $ 30,154 $ 321,944 $ (153,351) $ 57,000 $ 255,747
Year Ended January 31, 2010:
Revenue $ 2,660,176 $ 510,223 $ 156,046 $ - $ 3,326,445
Depreciation and amortization expense $ 139,298 $ 28,443 $ 28,923 $ - $ 196,664
Operating income (loss) $ (13,487) $ 148,953 $ (94,170) $ (140,241) $ (98,945)
Year Ended January 25, 2009:
Revenue $ 2,595,149 $ 693,376 $ 136,334 $ - $ 3,424,859
Depreciation and amortization expense $ 125,366 $ 29,089 $ 30,568 $ - $ 185,023
Operating income (loss) $ (246,212) $ 254,747 $ (52,367) $ (26,868) $ (70,700)
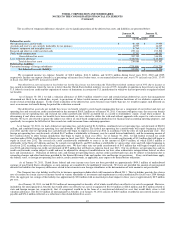
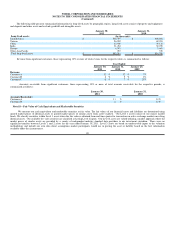
Revenue by geographic region is allocated to individual countries based on the location to which the products are initially billed even if our customers’
revenue is attributable to end customers that are located in a different location. The following tables summarize information pertaining to our revenue from
customers based on invoicing address in different geographic regions:
Year Ended
January 30,
2011 January 31,
2010 January 25,
2009
Revenue: (In thousands)
China $ 1,223,199 $ 1,304,196 $ 1,087,739
Taiwan 936,797 883,137 974,077
Other Asia Pacific 519,473 406,286 601,480
Europe 261,421 203,760 321,117
United States 297,265 248,793 309,540
Other Americas 305,154 280,273 130,906
Total revenue $ 3,543,309 $ 3,326,445 $ 3,424,859
89