NVIDIA 2011 Annual Report Download - page 48
Download and view the complete annual report
Please find page 48 of the 2011 NVIDIA annual report below. You can navigate through the pages in the report by either clicking on the pages listed below, or by using the keyword search tool below to find specific information within the annual report.-
 1
1 -
2
-
3
-
4
-
5
-
6
-
7
-
8
-
9
-
10
-
11
-
12
-
13
-
14
-
15
-
16
-
17
-
18
-
19
-
20
-
21
-
22
-
23
-
24
-
25
-
26
-
27
-
28
-
29
-
30
-
31
-
32
-
33
-
34
-
35
-
36
-
37
-
 38
38 -
 39
39 -
 40
40 -
 41
41 -
 42
42 -
 43
43 -
 44
44 -
 45
45 -
 46
46 -
 47
47 -
 48
48 -
 49
49 -
 50
50 -
 51
51 -
 52
52 -
 53
53 -
 54
54 -
 55
55 -
 56
56 -
 57
57 -
 58
58 -
59
-
60
-
61
-
62
-
63
-
64
-
65
-
66
-
67
-
68
-
69
-
70
-
71
-
72
-
73
-
74
-
75
-
76
-
77
-
78
-
79
-
80
-
81
-
82
-
83
-
84
-
85
-
86
-
87
-
88
-
89
-
90
-
91
-
92
-
93
-
94
-
95
-
96
-
97
-
98
-
99
-
100
-
101
-
102
-
103
-
104
-
105
-
106
-
107
-
108
-
109
-
110
-
111
-
112
-
113
-
114
-
115
-
116
 |
 |

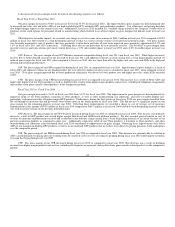
Legal Settlement
On January 10, 2011, we entered into a new six-year cross licensing agreement with Intel and also mutually agreed to settle all outstanding legal
disputes. The fair valued benefit prescribed to the legal settlement portion was $57.0 million and was recorded in the fourth quarter of fiscal year 2011.
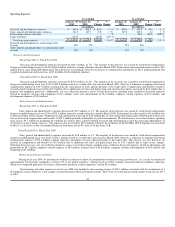
Interest Income and Interest Expense
Interest income, net of interest expense consists of interest earned on cash, cash equivalents and marketable securities. Interest income decreased to
$15.9 million in fiscal year 2011, from $19.8 million in fiscal year 2010 primarily due to the result of lower interest rates on our investments. Interest income
decreased to $19.8 million in fiscal year 2010 from $42.5 million in fiscal year 2009 primarily due to lower interest rates in fiscal year 2010 compared to
fiscal year 2009 and due to interest expense recorded on a capital lease in 2010.
Other Income (Expense), net
Other income and expense primarily consists of realized gains and losses on the sale of marketable securities and foreign currency translation. Other
(expense), net of other income was ($0.5) million, ($3.1) million, and $(14.7) million in fiscal years 2011, 2010, and 2009, respectively. The fluctuation
between these years was primarily due to other than temporary impairment of our investment in the money market funds held by the Reserve International
Liquidity Fund, Ltd., or International Reserve Fund that resulted in a charge of $5.6 million in fiscal year 2009, which was partially recovered in fiscal year
2011 for a gain of $3.0 million resulting from the final disbursement of this fund. Fiscal year 2009 also included other charges related to other than temporary
impairment of $2.5 million related to a decline in the value of publicly traded equity securities and $1.8 million related to debt securities held by us that were
issued by companies that had filed for bankruptcy. Please refer to Note 18 of the Notes to the Consolidated Financial Statements in Part IV, Item 15 of this
Form 10-K for further discussion.
Income Taxes
We recognized income tax expense (benefit) of $18.0 million, $(14.3) million, and $(12.9) million during fiscal years 2011, 2010 and 2009,
respectively. Income tax expense (benefit) as a percentage of income (loss) before taxes, or our annual effective tax rate, was 6.7% in fiscal year 2011, 17.4%
in fiscal year 2010, and 30.0% in fiscal year 2009.
Our effective tax rate on income or loss before tax for the fiscal years was lower than the United States federal statutory rate of 35% due to income or
loss earned in jurisdictions where the tax rate is lower than the United States federal statutory tax rate of 35%, favorable recognition in these fiscal years of the
U.S. federal research tax credit and the expiration of statues of limitations in certain non-U.S. jurisdictions for which we had not previously recognized related
tax benefits.
Please refer to Note 14 of these Notes to the Consolidated Financial Statements in Part IV, Item 15 of this Form 10-K for additional information.
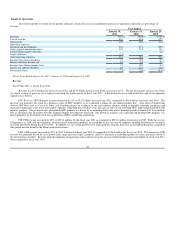
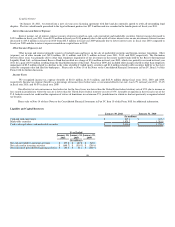
Liquidity and Capital Resources
January 30, 2011 January 31, 2010
(In millions)
Cash and cash equivalents $ 665.4 $ 447.2
Marketable securities 1,825.2 1,281.0
Cash, cash equivalents, and marketable securities $ 2,490.6 $ 1,728.2
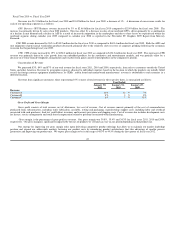
Year Ended
January 30, January 31, January 25,
2011 2010 2009
(In millions)
Net cash provided by operating activities $ 675.8 $ 487.8 $ 249.4
Net cash used in investing activities $ (649.7) $ (519.3) $ (209.4)
Net cash (used) provided by financing activities $ 192.0 $ 61.1 $ (349.3)
46