NVIDIA 2011 Annual Report Download - page 46
Download and view the complete annual report
Please find page 46 of the 2011 NVIDIA annual report below. You can navigate through the pages in the report by either clicking on the pages listed below, or by using the keyword search tool below to find specific information within the annual report.-
 1
1 -
2
-
3
-
4
-
5
-
6
-
7
-
8
-
9
-
10
-
11
-
12
-
13
-
14
-
15
-
16
-
17
-
18
-
19
-
20
-
21
-
22
-
23
-
24
-
25
-
26
-
27
-
28
-
29
-
30
-
31
-
32
-
33
-
34
-
35
-
 36
36 -
 37
37 -
 38
38 -
 39
39 -
 40
40 -
 41
41 -
 42
42 -
 43
43 -
 44
44 -
 45
45 -
 46
46 -
 47
47 -
 48
48 -
 49
49 -
 50
50 -
 51
51 -
 52
52 -
 53
53 -
 54
54 -
 55
55 -
 56
56 -
57
-
58
-
59
-
60
-
61
-
62
-
63
-
64
-
65
-
66
-
67
-
68
-
69
-
70
-
71
-
72
-
73
-
74
-
75
-
76
-
77
-
78
-
79
-
80
-
81
-
82
-
83
-
84
-
85
-
86
-
87
-
88
-
89
-
90
-
91
-
92
-
93
-
94
-
95
-
96
-
97
-
98
-
99
-
100
-
101
-
102
-
103
-
104
-
105
-
106
-
107
-
108
-
109
-
110
-
111
-
112
-
113
-
114
-
115
-
116
 |
 |

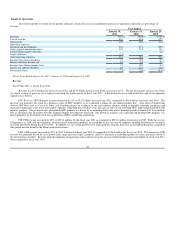
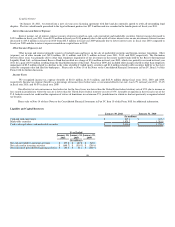
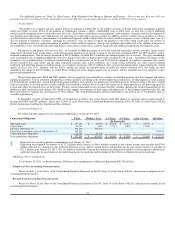
A discussion of our gross margin results for each of our operating segments is as follows:
Fiscal Year 2011 vs. Fiscal Year 2010
Our gross margin increased to 39.8% in fiscal year 2011 from 35.4% for fiscal year 2010. The improvement in gross margin was driven primarily due
to increased unit sales, mix and better ASPs of our high-end desktop GPU, notebook GPU and workstation products. Cost efficiencies and pricing decisions
also helped margin improve in the current fiscal year. Additionally, fiscal year 2010 included $11.4 million charge related to the Company’s tender offer to
purchase certain stock options for personnel related to manufacturing which resulted in an adverse impact on gross margins that did not occur in fiscal year
2011.
Offsetting these favorable impacts, we recorded a net charge to cost of revenue in the amount of $181.2 million in fiscal year 2011 compared to $95.9
million in fiscal year 2010 related to a weak die/packing material set that was used in certain versions of our previous generation chips. Our gross margin
was favorably impacted by sales of products that were previously written down and sales of such items improved gross margin by approximately 1.9% and
1.6% in fiscal years 2011 and 2010, respectively. Offsetting these releases are provisions for new inventory reserves. The net effect to gross margin from
inventory reserves and sales of items previously written down was a 3.0% unfavorable impact in fiscal year 2011 and a 0.2% favorable impact in fiscal year
2010.
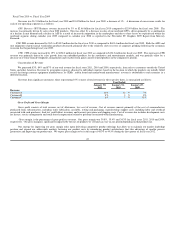
GPU Business. The gross margin of our GPU Business remained comparable during fiscal year 2011 and fiscal year 2010. While higher inventory
reserves due to future demand concerns in the first half of fiscal year 2011 and additional warranty accruals arising from a weak die/packaging material set
reduced gross margin for fiscal year 2011 when compared to fiscal year 2010, this was more than offset by higher unit sales, mix and ASPs in the high-end
desktop and notebook product lines.
PSB. The gross margin of our PSB remained flat during fiscal year 2011 as compared to fiscal year 2010. Improvements in gross margin as a result of
better ASPs and shipment volumes in our Quadro product line were offset by higher inventory reserves recorded in fiscal year 2011, when compared to fiscal
year 2010. Tesla gross margin improved due to better production efficiencies was driven by lower product cost and higher unit sales, while ASPs remained
stable.
CPB. The gross margin of our CPB increased during fiscal year 2011 as compared to fiscal year 2010. This increase was a result of better ASPs and
higher unit shipment of our Tegra products as well as slightly better revenue from higher margin products and services, including development arrangements
and royalties from game console-related products, in the comparative periods.
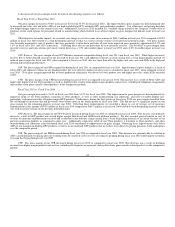
Fiscal Year 2010 vs. Fiscal Year 2009
Our gross margin increased to 35.4% in fiscal year 2010 from 34.3% for fiscal year 2009. The improvement in gross margin was driven primarily by
improved yields of our 55nm products, transition to 40nm products, as well as other manufacturing cost reductions, and more favorable product mix,
particularly with increased sales of higher margin MCP products. Furthermore, during the first quarter of fiscal year 2010 our gross margin benefited from
the sell-through of inventory that had previously been written down in the fourth quarter of fiscal year 2009. This did not have a significant impact on our
gross margin for the remaining quarters in fiscal year 2010. Offsetting these improvements, we recorded a charge to cost of revenue, net of insurance
reimbursement in the amount of $95.9 million in fiscal year 2010 compared to $189.3 million in fiscal year 2009 related to weak die/packing material set that
was used in certain versions of our previous generation chips.
GPU Business. The gross margin of our GPU business increased during fiscal year 2010 as compared to fiscal year 2009. This increase was primarily
driven by a shift in MCP product mix toward higher margin Intel-based and AMD-based platform products. We also recorded greater benefits to cost of
revenue for insurance reimbursement received and a reduction in the warranty charge arising from a weak die/packing material set in certain versions of our
previous generation products as compared to prior year. Additionally, improving yields of our 55nm products, a transition to 40nm products, and other
manufacturing cost reductions achieved during fiscal year 2010 contributed to improvements in gross margin. Offsetting these improvements were lower
ASPs in our mainstream desktop GPU products as well as in our notebook GPU products that we believe were driven by pricing pressures in the marketplace
over the comparable period.
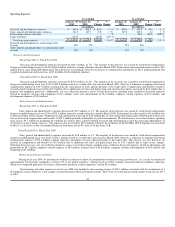
PSB. The gross margin of our PSB decreased during fiscal year 2010 as compared to fiscal year 2009. This decrease was primarily due to a decline in
ASPs caused primarily by pricing pressure resulting from the relatively slow recovery of corporate spending during fiscal year 2010 following the economic
recession that began during fiscal year 2009.
CPB. The gross margin of our CPB decreased during fiscal year 2010 as compared to fiscal year 2009. This decrease was a result of declining
revenue from higher margin products and services, including development arrangements and royalties from game console-related products, in the comparative
periods.
44