NVIDIA 2011 Annual Report Download - page 60
Download and view the complete annual report
Please find page 60 of the 2011 NVIDIA annual report below. You can navigate through the pages in the report by either clicking on the pages listed below, or by using the keyword search tool below to find specific information within the annual report.-
 1
1 -
2
-
3
-
4
-
5
-
6
-
7
-
8
-
9
-
10
-
11
-
12
-
13
-
14
-
15
-
16
-
17
-
18
-
19
-
20
-
21
-
22
-
23
-
24
-
25
-
26
-
27
-
28
-
29
-
30
-
31
-
32
-
33
-
34
-
35
-
36
-
37
-
38
-
39
-
40
-
41
-
42
-
43
-
44
-
45
-
46
-
47
-
48
-
49
-
 50
50 -
 51
51 -
 52
52 -
 53
53 -
 54
54 -
 55
55 -
 56
56 -
 57
57 -
 58
58 -
 59
59 -
 60
60 -
 61
61 -
 62
62 -
 63
63 -
 64
64 -
 65
65 -
 66
66 -
 67
67 -
 68
68 -
 69
69 -
 70
70 -
71
-
72
-
73
-
74
-
75
-
76
-
77
-
78
-
79
-
80
-
81
-
82
-
83
-
84
-
85
-
86
-
87
-
88
-
89
-
90
-
91
-
92
-
93
-
94
-
95
-
96
-
97
-
98
-
99
-
100
-
101
-
102
-
103
-
104
-
105
-
106
-
107
-
108
-
109
-
110
-
111
-
112
-
113
-
114
-
115
-
116
 |
 |

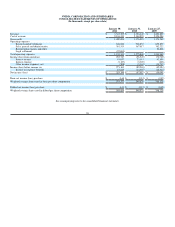
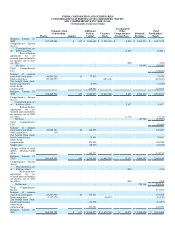
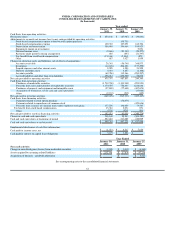
NVIDIA CORPORATION AND SUBSIDIARIES
CONSOLIDATED STATEMENTS OF OPERATIONS
(In thousands, except per share data)
January 30,
2011 January 31,
2010 January 25,
2009
Revenue $ 3,543,309 $ 3,326,445 $ 3,424,859
Cost of revenue 2,134,219 2,149,522 2,250,590
Gross profit 1,409,090 1,176,923 1,174,269
Operating expenses:
Research and development 848,830 908,851 855,879
Sales, general and administrative 361,513 367,017 362,222
Restructuring charges and other - - 26,868
Legal settlement (57,000) - -
Total operating expenses 1,153,343 1,275,868 1,244,969
Income (loss) from operations 255,747 (98,945) (70,700)
Interest income 19,057 23,115 42,859
Interest expense (3,127) (3,320) (406)
Other income (expense), net (508) (3,144) (14,707)
Income (loss) before income tax 271,169 (82,294) (42,954)
Income tax expense (benefit) 18,023 (14,307) (12,913)
Net income (loss) $ 253,146 $ (67,987) $ (30,041)
Basic net income (loss) per share $ 0.44 $ (0.12) $ (0.05)
Weighted average shares used in basic per share computation 575,177 549,574 548,126
Diluted net income (loss) per share $ 0.43 $ (0.12) $ (0.05)
Weighted average shares used in diluted per share computation 588,684 549,574 548,126
See accompanying notes to the consolidated financial statements.
58