NVIDIA 2011 Annual Report Download - page 62
Download and view the complete annual report
Please find page 62 of the 2011 NVIDIA annual report below. You can navigate through the pages in the report by either clicking on the pages listed below, or by using the keyword search tool below to find specific information within the annual report.-
 1
1 -
2
-
3
-
4
-
5
-
6
-
7
-
8
-
9
-
10
-
11
-
12
-
13
-
14
-
15
-
16
-
17
-
18
-
19
-
20
-
21
-
22
-
23
-
24
-
25
-
26
-
27
-
28
-
29
-
30
-
31
-
32
-
33
-
34
-
35
-
36
-
37
-
38
-
39
-
40
-
41
-
42
-
43
-
44
-
45
-
46
-
47
-
48
-
49
-
50
-
51
-
 52
52 -
 53
53 -
 54
54 -
 55
55 -
 56
56 -
 57
57 -
 58
58 -
 59
59 -
 60
60 -
 61
61 -
 62
62 -
 63
63 -
 64
64 -
 65
65 -
 66
66 -
 67
67 -
 68
68 -
 69
69 -
 70
70 -
 71
71 -
 72
72 -
73
-
74
-
75
-
76
-
77
-
78
-
79
-
80
-
81
-
82
-
83
-
84
-
85
-
86
-
87
-
88
-
89
-
90
-
91
-
92
-
93
-
94
-
95
-
96
-
97
-
98
-
99
-
100
-
101
-
102
-
103
-
104
-
105
-
106
-
107
-
108
-
109
-
110
-
111
-
112
-
113
-
114
-
115
-
116
 |
 |

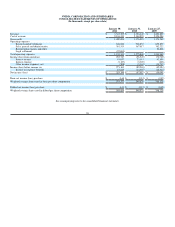
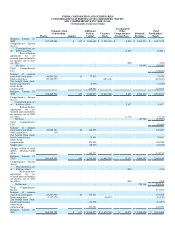
NVIDIA CORPORATION AND SUBSIDIARIES
CONSOLIDATED STATEMENTS OF STOCKHOLDERS’ EQUITY
AND COMPREHENSIVE INCOME (LOSS)
(In thousands, except share data)
Common Stock
Outstanding
Shares Amount
Additional
Paid-in
Capital Treasury
Stock
Accumulated
Other
Comprehensive
Income(Loss) Retained
Earnings
Total
Stockholders'
Equity
Balances, January 27,
2008 557,102,588 $ 619 $ 1,654,681
$ (1,039,632) $ 8,034 $ 1,994,210 $ 2,617,912
Comprehensive Income
(Loss):
Unrealized loss, net
of $2054 tax effect - - - - (3,920) - (3,920 )
Reclassification
adjustment for net
realized gains included in
net income, net of $135
tax effect - - - - (249) - (249)
Net Loss - - - - (30,041) (30,041)
Total Comprehensive
Loss (34,210)
Issuance of common
stock from stock plans 10,685,101 10 73,537 - - - 73,547
Stock repurchase (29,326,923) - - (423,636) - - (423,636)
Tax benefit from stock-
based compensation - - (2,946) - - - (2,946)
Stock-based
compensation - - 163,985 - - - 163,985
Balances, January 25,
2009 538,460,766 629 1,889,257 (1,463,268) 3,865 1,964,169 2,394,652
Comprehensive Income
(Loss):
Unrealized gain, net
of $484 tax effect - - - - 9,417 - 9,417
Reclassification
adjustment for net
realized gains included in
net income, net of $598
tax effect - - - - (1,110) - (1,110)
Net Loss - - - - - (67,987) (67,987)
Total Comprehensive
Loss (59,680)
Issuance of common
stock from stock plans 23,005,124 24 138,005 - - - 138,029
Stock repurchase (39) - - - - - -
Tax benefit from stock-
based compensation - - 29,891 - - - 29,891
Stock-based
compensation - - 104,588 - - - 104,588
Tender offer - - (78,075) - - - (78,075)
Charges related to stock
option purchase-tender
offer - - 135,735 - - - 135,735
Balances, January 31,
2010 561,465,851 653 2,219,401 (1,463,268) 12,172 1,896,182 2,665,140
Comprehensive Income
(Loss):
Unrealized loss, net
of $306 tax effect - - - - (918) - (918)
Reclassification
adjustment for net
realized gains included in
net income, net of $528
tax effect - - - - (982) - (982)
Net Income - - - - - 253,146 253,146
Total Comprehensive
Income - - - - - - 251,246
Issuance of common
stock from stock plans 28,207,029 24 193,381 - - - 193,405
Stock repurchase (1,117,179) - - (16,124) - - (16,124)
Tax benefit from stock-
based compensation - - (14,201) - - - (14,201)
Stock-based
compensation - - 101,996 - - - 101,996
Balances, January 30,
2011 588,555,701 $ 677 $ 2,500,577 $ (1,479,392) $ 10,272 $ 2,149,328 $ 3,181,462