Mazda 2007 Annual Report Download - page 9
Download and view the complete annual report
Please find page 9 of the 2007 Mazda annual report below. You can navigate through the pages in the report by either clicking on the pages listed below, or by using the keyword search tool below to find specific information within the annual report.-
 1
1 -
 2
2 -
 3
3 -
 4
4 -
 5
5 -
 6
6 -
 7
7 -
 8
8 -
 9
9 -
 10
10 -
 11
11 -
 12
12 -
 13
13 -
 14
14 -
 15
15 -
 16
16 -
 17
17 -
 18
18 -
 19
19 -
 20
20 -
21
-
22
-
23
-
24
-
25
-
26
-
27
-
28
-
29
-
30
-
31
-
32
-
33
-
34
-
35
-
36
-
37
-
38
-
39
-
40
-
41
-
42
-
43
-
44
-
45
-
46
-
47
-
48
-
49
-
50
-
51
-
52
-
53
-
54
-
55
-
56
-
57
-
58
-
59
-
60
-
61
-
62
-
63
-
64
-
65
-
66
-
67
-
68
-
69
-
70
-
71
-
72
-
73
-
74
-
75
-
76
-
77
-
78
-
79
-
80
-
81
-
82
-
83
-
84
-
85
-
86
-
87
-
88
 |
 |

3
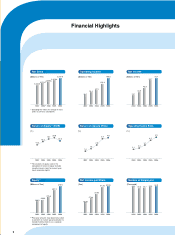
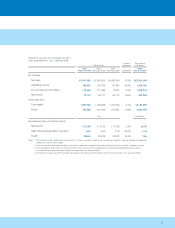
Increase Thousands of
Millions of Yen (decrease) U.S. dollars*1
2006 2005 2004 2006
March 31, 2007 March 30, 2006 March 30, 2005 2006/2005 March 31,2007
For the year:
Net sales
Operating income
Income before income taxes
Net income
At the year-end:
Total assets
Equity*2
Yen U.S. dollars*1
Amounts per share of common stock:
Net income*3
Cash dividends applicable to the year*4
Equity*5
¥3,247,485 ¥2,919,823 ¥2,695,564 11.2% $27,521,059
158,532 123,435 82,947 28.4% 1,343,492
118,450 117,468 73,847 0.8% 1,003,814
73,744 66,711 45,772 10.5% 624,949
1,907,752 1,788,659 1,767,846 6.7% 16,167,390
479,882 407,208 275,841 17.8% 4,066,797
¥052.59 ¥051.53 ¥037.63 2.1% $0.45
6.00 5.00 3.00 20.0% 0.05
336.45 284.28 220.22 18.4% 2.85
Notes: 1. The translation of the Japanese yen amounts into U.S. dollars is presented solely for the convenience of readers, using the prevailing exchange rate
at March 31, 2007 of ¥118 to US$1.
2. Prior-year amounts have been reclassified to conform to current year presentation to include minority interests as a separate component of equity.
3. The computations of net income per share of common stock are based on the average number of shares outstanding during each fiscal year.
4. Cash dividends per share represent actual amounts applicable to the respective years.
5. The amounts of equity used in the calculation of equity per share exclude minority interests (and, for the current year, stock acquisition rights).
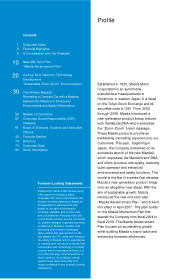
Mazda Motor Corporation and Consolidated Subsidiaries
Years ended March 31, 2007, 2006 and 2005