Mazda 2007 Annual Report Download - page 50
Download and view the complete annual report
Please find page 50 of the 2007 Mazda annual report below. You can navigate through the pages in the report by either clicking on the pages listed below, or by using the keyword search tool below to find specific information within the annual report.-
 1
1 -
2
-
3
-
4
-
5
-
6
-
7
-
8
-
9
-
10
-
11
-
12
-
13
-
14
-
15
-
16
-
17
-
18
-
19
-
20
-
21
-
22
-
23
-
24
-
25
-
26
-
27
-
28
-
29
-
30
-
31
-
32
-
33
-
34
-
35
-
36
-
37
-
38
-
39
-
 40
40 -
 41
41 -
 42
42 -
 43
43 -
 44
44 -
 45
45 -
 46
46 -
 47
47 -
 48
48 -
 49
49 -
 50
50 -
 51
51 -
 52
52 -
 53
53 -
 54
54 -
 55
55 -
 56
56 -
 57
57 -
 58
58 -
 59
59 -
 60
60 -
61
-
62
-
63
-
64
-
65
-
66
-
67
-
68
-
69
-
70
-
71
-
72
-
73
-
74
-
75
-
76
-
77
-
78
-
79
-
80
-
81
-
82
-
83
-
84
-
85
-
86
-
87
-
88
 |
 |

44
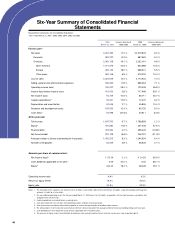
Six-Year Summary of Consolidated Financial
Statements
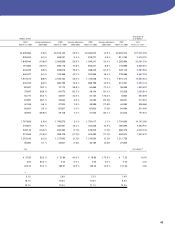
2006 Increase (decrease) 2005 Increase (decrease)
March 31, 2007 2006/2005 March 31, 2006 2005/2004
For the year*2:
Net sales 3,247,485 11.2 % ¥2,919,823 8.3 %
Domestic 887,327 (0.0)% 887,662 5.0 %
Overseas 2,360,158 16.1 % 2,032,161 9.8 %
North America 1,017,874 20.6 % 843,988 10.8 %
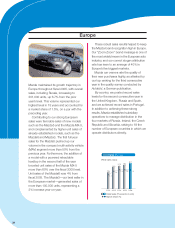
Europe 789,135 18.0 % 668,941 5.5 %
Other areas 553,149 6.5 % 519,232 14.4 %
Cost of sales 2,322,644 10.0 % 2,110,934 7.0 %
Selling, general and administrative expenses 766,309 11.8 % 685,454 7.1 %
Operating income (loss) 158,532 28.4 % 123,435 48.8 %
Income (loss) before income taxes 118,450 0.8 % 117,468 59.1 %
Net income (loss) 73,744 10.5 % 66,711 45.7 %
Capital expenditures*379,641 10.5 % 72,070 6.2 %
Depreciation and amortization 47,045 2.7 % 45,805 14.4 %
Research and development costs 107,553 12.4 % 95,730 5.4 %
Cash flows*420,995 (37.5)% 33,611 (6.4)%
At the year-end:
Total assets 1,907,752 6.7 % 1,788,659 1.2 %
Equity*5479,882 17.8 % 407,208 47.6 %
Financial debt 474,684 4.2 % 455,409 (13.8)%
Net financial debt 232,179 (5.9)% 246,751 (21.3)%
Average number of shares outstanding (in thousands) 1,402,315 8.3 % 1,294,534 6.4 %
Number of employees 38,004 3.8 % 36,626 2.7 %
Amounts per share of common stock:
Net income (loss)*6¥052.59 2.1 % ¥051.53 36.9 %
Cash dividends applicable to the year*76.00 20.0 % 5.00 66.7 %
Equity*8336.45 18.4 % 284.28 29.1 %
Operating income ratio 4.9% 4.2%
Return on equity (ROE) 16.9% 20.0%
Equity ratio 24.8% 22.3%
Notes: 1. The translation of the Japanese yen amounts into U.S. dollars is presented solely for the convenience of readers, using the prevailing exchange rate
at March 31, 2007 of ¥118 to US$1.
2. The consolidated operating results for the year ended March 31, 2004 consist of 15 months of operations for the major overseas subsidiaries that
changed their fiscal year-ends.
3. Capital expenditures are calculated on an accrual basis.
4. Cash flows represent net cash flows from operating activities and from investing activities.
5. Prior-year amounts have been reclassified to conform to current year presentation to include minority interests.
6. The computations of net income (loss) per share of common stock are based on the average number of shares outstanding during each fiscal year.
7. Cash dividends per share represent actual amounts applicable to the respective years.
8. The amounts of equity used in the calculation of equity per share exclude minority interests (and, for current year, stock acquisition rights).
Mazda Motor Corporation and Consolidated Subsidiaries
Years ended March 31, 2007, 2006, 2005, 2004, 2003 and 2002