Mazda 2007 Annual Report Download - page 79
Download and view the complete annual report
Please find page 79 of the 2007 Mazda annual report below. You can navigate through the pages in the report by either clicking on the pages listed below, or by using the keyword search tool below to find specific information within the annual report.-
 1
1 -
2
-
3
-
4
-
5
-
6
-
7
-
8
-
9
-
10
-
11
-
12
-
13
-
14
-
15
-
16
-
17
-
18
-
19
-
20
-
21
-
22
-
23
-
24
-
25
-
26
-
27
-
28
-
29
-
30
-
31
-
32
-
33
-
34
-
35
-
36
-
37
-
38
-
39
-
40
-
41
-
42
-
43
-
44
-
45
-
46
-
47
-
48
-
49
-
50
-
51
-
52
-
53
-
54
-
55
-
56
-
57
-
58
-
59
-
60
-
61
-
62
-
63
-
64
-
65
-
66
-
67
-
68
-
 69
69 -
 70
70 -
 71
71 -
 72
72 -
 73
73 -
 74
74 -
 75
75 -
 76
76 -
 77
77 -
 78
78 -
 79
79 -
 80
80 -
 81
81 -
 82
82 -
 83
83 -
 84
84 -
 85
85 -
 86
86 -
 87
87 -
 88
88
 |
 |
73
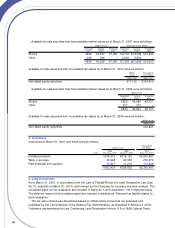
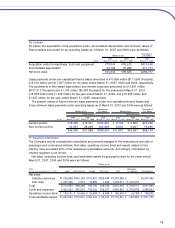
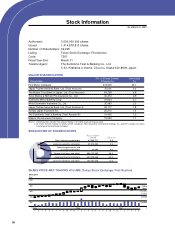
16. Leases
As lessee, the equivalents of the acquisition costs, accumulated depreciation and net book values of
finance leases accounted for as operating leases as of March 31, 2007 and 2006 were as follows:
Thousands of
Millions of yen U.S. dollars
2006 2005 2006
As of March 31, 2007 March 31, 2006 March 31, 2007
Acquisition costs for machinery, tools and equipment ¥72,040 ¥76,910 $610,508
Accumulated depreciation 36,782 37,285 311,711
Net book value ¥35,258 ¥39,625 $298,797
Lease payments under non-capitalized finance leases amounted to ¥13,866 million ($117,508 thousand),
¥14,514 million and ¥17,957 million for the years ended March 31, 2007, 2006 and 2005, respectively.
The equivalents of the related depreciation and interest expenses amounted to ¥12,651 million
($107,212 thousand) and ¥1,105 million ($9,364 thousand) for the year ended March 31, 2007,
¥12,878 million and ¥1,248 million for the year ended March 31, 2006, and ¥15,035 million and
¥1,637 million for the year ended March 31, 2005, respectively.
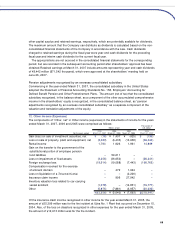
The present values of future minimum lease payments under non-capitalized finance leases and
future minimum lease payments under operating leases as of March 31, 2007 and 2006 were as follows:
Thousands of Thousands of
Millions of yen U.S. dollars Millions of yen U.S. dollars
Finance leases Operating leases
2006 2005 2006 2006 2005 2006
As of March 31, 2007 March 31, 2006 March 31, 2007 March 31, 2007 March 31, 2006 March 31, 2007
Current portion ¥12,455 ¥13,301 $105,551 ¥02,748 ¥05,860 $23,288
Non-current portion 23,941 28,295 202,890 8,833 9,607 74,856
¥36,396 ¥41,596 $308,441 ¥11,581 ¥15,467 $98,144
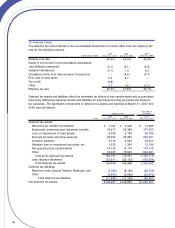
17. Segment Information
The Company and its consolidated subsidiaries are primarily engaged in the manufacture and sale of
passenger and commercial vehicles. Net sales, operating income (loss) and assets related to this
industry have exceeded 90% of the respective consolidated amounts. Accordingly, information by
industry segment is not shown.
Net sales, operating income (loss) and identifiable assets by geographic area for the years ended
March 31, 2007, 2006 and 2005 were as follows:
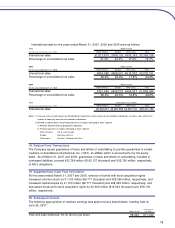
Millions of yen
2006 Elimination
For the year ended March 31, 2007 Japan North America Europe Other areas Total or corporate Consolidated
Net sales:
Outside customers
¥1,226,988 ¥991,192 ¥774,837 ¥254,468 ¥3,247,485 ¥(((((((((((((((–.¥3,247,485
Inter-area
1,347,406 7,074 19,899 1,638 1,376,017 (1,376,017) –
Total
2,574,394 998,266 794,736 256,106 4,623,502 (1,376,017) 3,247,485
Costs and expenses
2,451,263 982,810 779,242 246,517 4,459,832 (1,370,879) 3,088,953
Operating income (loss)
¥0,123,131 ¥015,456 ¥015,494 ¥009,589 ¥0,163,670 ¥((((((((5,138) ¥0,158,532
Total identifiable assets
¥1,663,264 ¥219,947 ¥166,276 ¥056,074 ¥2,105,561 ¥((((197,809) ¥1,907,752