Mazda 2007 Annual Report Download - page 56
Download and view the complete annual report
Please find page 56 of the 2007 Mazda annual report below. You can navigate through the pages in the report by either clicking on the pages listed below, or by using the keyword search tool below to find specific information within the annual report.-
 1
1 -
2
-
3
-
4
-
5
-
6
-
7
-
8
-
9
-
10
-
11
-
12
-
13
-
14
-
15
-
16
-
17
-
18
-
19
-
20
-
21
-
22
-
23
-
24
-
25
-
26
-
27
-
28
-
29
-
30
-
31
-
32
-
33
-
34
-
35
-
36
-
37
-
38
-
39
-
40
-
41
-
42
-
43
-
44
-
45
-
 46
46 -
 47
47 -
 48
48 -
 49
49 -
 50
50 -
 51
51 -
 52
52 -
 53
53 -
 54
54 -
 55
55 -
 56
56 -
 57
57 -
 58
58 -
 59
59 -
 60
60 -
 61
61 -
 62
62 -
 63
63 -
 64
64 -
 65
65 -
 66
66 -
67
-
68
-
69
-
70
-
71
-
72
-
73
-
74
-
75
-
76
-
77
-
78
-
79
-
80
-
81
-
82
-
83
-
84
-
85
-
86
-
87
-
88
 |
 |

50
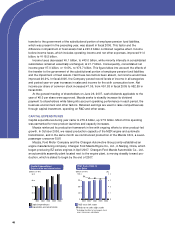
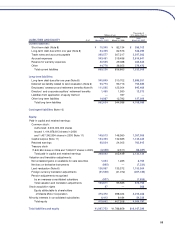
Current liabilities expanded ¥28.4 billion, to ¥865.2 billion, as accrued expenses grew in line
with higher unit sales in North America. Long-term liabilities rose ¥18.0 billion, to ¥562.6 billion,
chiefly owing to bond issuance and increases in long-term debt. Interest-bearing debt—the
sum of short- and long-term debt—was ¥474.7 billion at the end of the term, up ¥19.3 billion
from one year earlier. Net financial debt, or financial debt less the ¥242.5 billion in cash and
cash equivalents at the end of the year, was ¥232.2 billion, a ¥14.6 billion improvement.
Accordingly, the net debt-to-equity ratio improved 13 percentage points, to 49%.
Equity at the end of the year totaled ¥479.9 billion, up ¥72.3 billion from one year earlier,
chiefly because of ¥73.7 billion in net income during the term. Equity per share rose 18.4%,
from ¥284.28 to ¥336.45. Equity ratio on March 31, 2007, was 24.8%, up 2.5 percentage
points from one year earlier. Equity used in the calculation of equity per share and equity ratio
exclude minority interests (and, for the current year, stock acquisition rights), which amounted to
¥473.4 billion as of March 31, 2007.
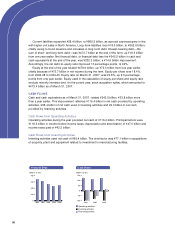
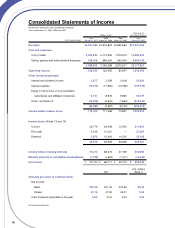
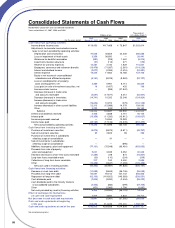
CASH FLOWS
Cash and cash equivalents as of March 31, 2007, totaled ¥242.5 billion, ¥33.8 billion more
than a year earlier. This improvement reflected ¥116.4 billion in net cash provided by operating
activities, ¥95.4 billion of net cash used in investing activities and ¥9.3 billion in net cash
provided by financing activities.
Cash Flows from Operating Activities
Operating activities during the year provided net cash of ¥116.4 billion. Principal factors were
¥118.5 billion in income before income taxes, depreciation and amortization of ¥47.0 billion and
income taxes paid of ¥42.2 billion.
Cash Flows from Investing Activities
Investing activities used net cash of ¥95.4 billion. The chief factor was ¥77.1 billion in acquisitions
of property, plant and equipment related to investment in manufacturing facilities.
(Billions of Yen) (Billions of Yen)
Cash FlowsFinancial Debt
200620052004
20062005200420032002
0
200
400
600
800
Operating activities
Investing activities
Financing activities
-100
-50
0
50
100
150