Mazda 2007 Annual Report Download - page 80
Download and view the complete annual report
Please find page 80 of the 2007 Mazda annual report below. You can navigate through the pages in the report by either clicking on the pages listed below, or by using the keyword search tool below to find specific information within the annual report.-
 1
1 -
2
-
3
-
4
-
5
-
6
-
7
-
8
-
9
-
10
-
11
-
12
-
13
-
14
-
15
-
16
-
17
-
18
-
19
-
20
-
21
-
22
-
23
-
24
-
25
-
26
-
27
-
28
-
29
-
30
-
31
-
32
-
33
-
34
-
35
-
36
-
37
-
38
-
39
-
40
-
41
-
42
-
43
-
44
-
45
-
46
-
47
-
48
-
49
-
50
-
51
-
52
-
53
-
54
-
55
-
56
-
57
-
58
-
59
-
60
-
61
-
62
-
63
-
64
-
65
-
66
-
67
-
68
-
69
-
 70
70 -
 71
71 -
 72
72 -
 73
73 -
 74
74 -
 75
75 -
 76
76 -
 77
77 -
 78
78 -
 79
79 -
 80
80 -
 81
81 -
 82
82 -
 83
83 -
 84
84 -
 85
85 -
 86
86 -
 87
87 -
 88
88
 |
 |

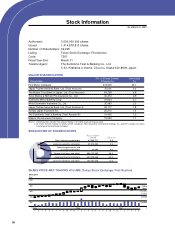
74
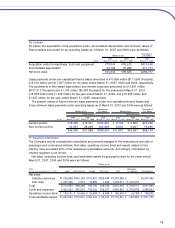
Millions of yen
2005 Elimination
For the year ended March 31, 2006 Japan North America Europe Other areas Total or corporate Consolidated
Net sales:
Outside customers
¥1,213,283 ¥823,447 ¥655,370 ¥227,723 ¥2,919,823 ¥ –.¥2,919,823
Inter-area
1,056,948 7,397 18,275 1,106 1,083,726 (1,083,726) –
Total
2,270,231 830,844 673,645 228,829 4,003,549 (1,083,726) 2,919,823
Costs and expenses
2,169,998 816,941 664,074 220,237 3,871,250 (1,074,862) 2,796,388
Operating income (loss)
¥0,100,233 ¥013,903 ¥009,571 ¥008,592 ¥0,132,299 ¥(8,864) ¥,0123,435
Total identifiable assets
¥1,556,200 ¥202,238 ¥143,626 ¥048,148 ¥1,950,212 ¥ (161,553) ¥1,788,659
Millions of yen
2004 Elimination
For the year ended March 31, 2005 Japan North America Europe Other areas Total or corporate Consolidated
Net sales:
Outside customers
¥1,136,102 ¥751,506 ¥625,277 ¥182,679 ¥2,695,564 ¥ –¥2,695,564
Inter-area
948,084 12,829 13,749 92 974,754 (974,754) –
Total
2,084,186 764,335 639,026 182,771 3,670,318 (974,754) 2,695,564
Costs and expenses
2,025,413 755,547 630,413 177,090 3,588,463 (975,846) 2,612,617
Operating income (loss)
¥00,58,773 ¥008,788 ¥008,613 ¥005,681 ¥0,081,855 ¥0001,092 ¥0,082,947
Total identifiable assets
¥1,522,641 ¥192,154 ¥121,421 ¥041,283 ¥1,877,499 ¥ (109,653) ¥1,767,846
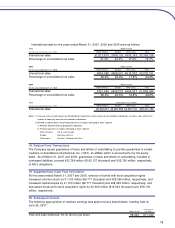
Thousands of U.S. dollars
2006 Elimination
For the year ended March 31, 2007 Japan North America Europe Other areas Total or corporate Consolidated
Net sales:
Outside customers
$10,398,203 $8,399,932 $6,566,415 $2,156,509 $27,521,059 $ –.$27,521,059
Inter-area
11,418,695 59,949 168,636 13,881 11,661,161 (11,661,161) –
Total
21,816,898 8,459,881 6,735,051 2,170,390 39,182,220 (11,661,161) 27,521,059
Costs and expenses
20,773,415 8,328,898 6,603,746 2,089,127 37,795,186 (11,617,619) 26,177,567
Operating income (loss)
$01,043,483 $0,130,983 $0,131,305 $0,081,263 $01,387,034 $ (43,542) $01,343,492
Total identifiable assets
$14,095,458 $1,863,958 $1,409,118 $0,475,203 $17,843,737 $ (1,676,347) $16,167,390
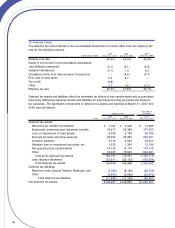
Notes: 1) Method of segmentation and principal counties or regions belonging to each segment
a) Method: Segmentation by geographic adjacency
b) Principal countries or regions belonging to each segment
North America: U.S.A. and Canada
Europe: Germany, Belgium and U.K.
Other areas: Australia and Colombia
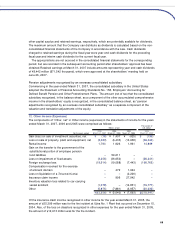
2) As discussed in the accounting for share-based payment section of the adoption of new accounting standards, commencing in the
year ended March 31, 2007, the Domestic Companies adopted the ASBJ Statement No. 8, Accounting Standard for Share-based
Payment, issued by the ASBJ on December 27, 2005 and the ASBJ Guidance No. 11 (revised 2006), Guidance on Accounting for
Share-based Payment, last revised by the ASBJ on May 31, 2006. The effects of adopting the new standard on the consolidated
statement of income for the year ended March 31, 2007 were to increase the operating expenses and to decrease the operating
income in the Japan segment by ¥67 million.