Macy's 2011 Annual Report Download - page 92
Download and view the complete annual report
Please find page 92 of the 2011 Macy's annual report below. You can navigate through the pages in the report by either clicking on the pages listed below, or by using the keyword search tool below to find specific information within the annual report.-
 1
1 -
2
-
3
-
4
-
5
-
6
-
7
-
8
-
9
-
10
-
11
-
12
-
13
-
14
-
15
-
16
-
17
-
18
-
19
-
20
-
21
-
22
-
23
-
24
-
25
-
26
-
27
-
28
-
29
-
30
-
31
-
32
-
33
-
34
-
35
-
36
-
37
-
38
-
39
-
40
-
41
-
42
-
43
-
44
-
45
-
46
-
47
-
48
-
49
-
50
-
51
-
52
-
53
-
54
-
55
-
56
-
57
-
58
-
59
-
60
-
61
-
62
-
63
-
64
-
65
-
66
-
67
-
68
-
69
-
70
-
71
-
72
-
73
-
74
-
75
-
76
-
77
-
78
-
79
-
80
-
81
-
 82
82 -
 83
83 -
 84
84 -
 85
85 -
 86
86 -
 87
87 -
 88
88 -
 89
89 -
 90
90 -
 91
91 -
 92
92 -
 93
93 -
 94
94 -
 95
95 -
 96
96
 |
 |
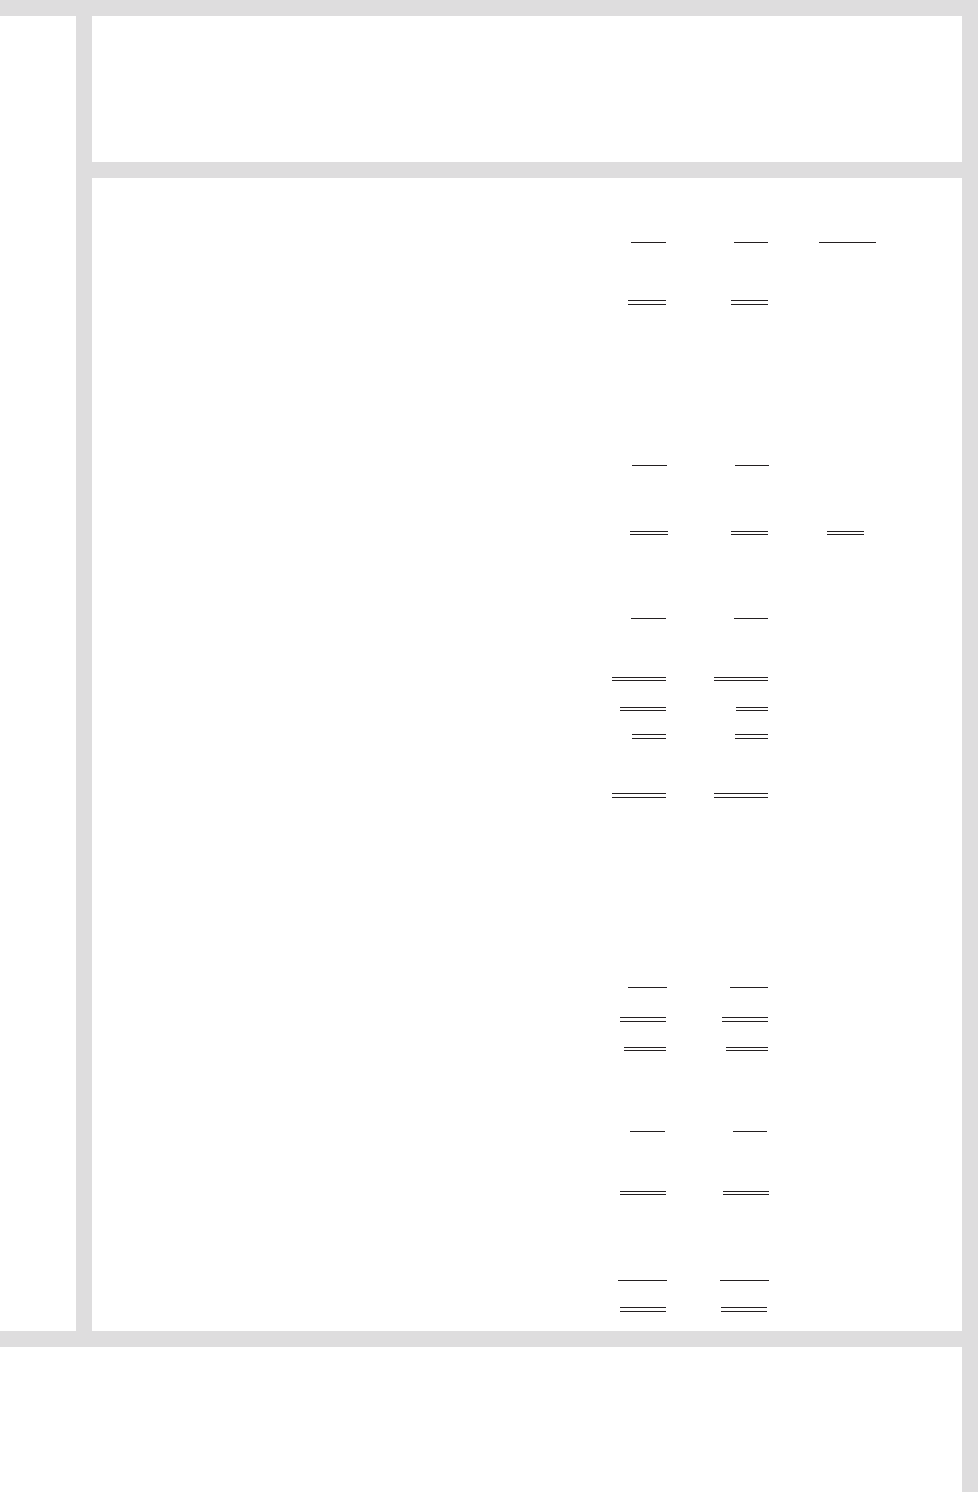
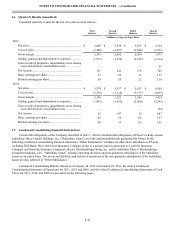
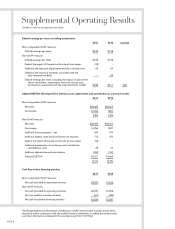
Supplemental Operating Results
(Dollars in millions, except per share data)
Diluted earnings per share, excluding certain items
2011 2010 Increase
Most comparable GAAP measure:
Diluted earnings per share $2.92 $1.98
Non-GAAP measure:
Diluted earnings per share $2.92 $1.98
Deduct the impact of the gain on the sale of store leases (.08 –
Add back the impact of impairments and store closing costs .04 .04
Add back the impact of expenses associated with the
early retirement of debt – .09
Diluted earnings per share, excluding the impact of gain on the
sale of store leases, impairments and store closing costs,
and expenses associated with the early retirement of debt $2.88 $2.11 36%
Adjusted EBITDA (Earnings before interest, taxes, depreciation and amortization) as a percent to sales
2011 2010
Most comparable GAAP measure:
Net sales $26,405 $25,003
Net income $1,256 $847
4.8% 3.4%
Non-GAAP measure:
Net sales $26,405 $25,003
Net income $1,256 $847
Add back interest expense – net 443 574
Add back federal, state and local income tax expense 712 473
Deduct the impact of the gain on the sale of store leases (54 –
Add back impairments, store closing costs and division
consolidation costs 29 25
Add back depreciation and amortization 1,085 1,150
Adjusted EBITDA $3,471 $3,069
13.1% 12.3%
Cash flow before financing activities
2011 2010
Most comparable GAAP measure:
Net cash provided by operating activities $2,093 $1,506
Non-GAAP measure:
Net cash provided by operating activities $2,093 $1,506
Net cash used by investing activities (617 (465
Net cash flow before financing activities $1,476 $1,041
The foregoing financial information, including non-GAAP measures that exclude certain items,
should be read in conjunction with the audited financial statements, including the related notes
and other information contained in the accompanying Form 10-K filing.
)
)
) )
PAGE 3