Macy's 2011 Annual Report Download - page 21
Download and view the complete annual report
Please find page 21 of the 2011 Macy's annual report below. You can navigate through the pages in the report by either clicking on the pages listed below, or by using the keyword search tool below to find specific information within the annual report.-
 1
1 -
2
-
3
-
4
-
5
-
6
-
7
-
8
-
9
-
10
-
 11
11 -
 12
12 -
 13
13 -
 14
14 -
 15
15 -
 16
16 -
 17
17 -
 18
18 -
 19
19 -
 20
20 -
 21
21 -
 22
22 -
 23
23 -
 24
24 -
 25
25 -
 26
26 -
 27
27 -
 28
28 -
 29
29 -
 30
30 -
 31
31 -
32
-
33
-
34
-
35
-
36
-
37
-
38
-
39
-
40
-
41
-
42
-
43
-
44
-
45
-
46
-
47
-
48
-
49
-
50
-
51
-
52
-
53
-
54
-
55
-
56
-
57
-
58
-
59
-
60
-
61
-
62
-
63
-
64
-
65
-
66
-
67
-
68
-
69
-
70
-
71
-
72
-
73
-
74
-
75
-
76
-
77
-
78
-
79
-
80
-
81
-
82
-
83
-
84
-
85
-
86
-
87
-
88
-
89
-
90
-
91
-
92
-
93
-
94
-
95
-
96
 |
 |
15
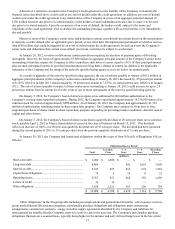
Comparison of the 52 Weeks Ended January 29, 2011 and January 30, 2010. Net income for 2010 was $847 million,
compared to net income of $329 million for 2009, reflecting the benefits of the strategic initiatives at Macy's and the continued
strong performance at Bloomingdale's. The net income for 2010 included the impact of $25 million of impairments and store
closing costs and approximately $66 million of expenses associated with the early retirement of debt. The net income for 2009
included the impact of $391 million of impairments, store closing costs and division consolidation costs.
Net sales for 2010 totaled $25,003 million, compared to net sales of $23,489 million for 2009, an increase of $1,514
million or 6.4%. On a comparable store basis, net sales for 2010 were up 4.6% compared to 2009. Sales from the Company's
Internet businesses in 2010 increased 28.7% compared to 2009 and positively affected the Company's 2010 comparable store
sales by 0.9%. The Company has realized continued success in the My Macy's localization strategy. Geographically, sales in
2010 were strongest in Florida and the upper Midwest. By family of business, sales in 2010 were strongest in updated women's
apparel, particularly the Company's I-N-C brand, jewelry and watches, men's apparel and accessories, luggage, furniture and
mattresses. Sales of the Company's private label brands continued to be strong and represented approximately 20% of net sales
in the Macy's-branded stores in 2010. Sales in 2010 were less strong in traditional women's sportswear. The Company
calculates comparable store sales as sales from stores in operation throughout 2009 and 2010 and all net Internet sales. Stores
undergoing remodeling, expansion or relocation remain in the comparable store sales calculation unless the store is closed for a
significant period of time. Definitions and calculations of comparable store sales differ among companies in the retail industry.
Cost of sales was $14,824 million or 59.3% of net sales for 2010, compared to $13,973 million or 59.5% of net sales for
2009, an increase of $851 million. The improved cost of sales rate reflected the benefit of good inventory management
throughout 2010. The valuation of merchandise inventories on the last-in, first-out basis did not impact cost of sales in either
period.
SG&A expenses were $8,260 million or 33.0% of net sales for 2010, compared to $8,062 million or 34.3% of net sales
for 2009, an increase of $198 million. The SG&A rate as a percent of net sales was lower in 2010, as compared to 2009,
reflecting an increase in net sales. SG&A expenses in 2010 increased due to higher selling costs as a result of stronger sales,
higher workers' compensation and general liability insurance costs, higher pension and supplementary retirement plan expense,
and higher costs in support of the Company's omnichannel operations, partially offset by lower depreciation and amortization
expense, lower stock-based compensation expense, higher income from credit operations and lower advertising expense.
Workers' compensation and general liability insurance costs were $148 million for 2010, compared to $124 million for 2009.
Pension and supplementary retirement plan expense amounted to $144 million for 2010, compared to $110 million for 2009.
Depreciation and amortization expense was $1,150 million for 2010, compared to $1,210 million for 2009. Stock-based
compensation expense was $66 million for 2010, compared to $76 million for 2009. Income from credit operations was $332
million in 2010 as compared to $323 million in 2009. Advertising expense, net of cooperative advertising allowances, was
$1,072 million for 2010 compared to $1,087 million for 2009.
Impairments and store closing costs for 2010 amounted to $25 million and included $18 million of asset impairment
charges and $7 million of other costs and expenses related to the store closings announced in January 2011.
Impairments, store closing costs and division consolidation costs for 2009 amounted to $391 million and included $115
million of asset impairment charges, $6 million of other costs and expenses related to the store closings announced in January
2010, and $270 million of restructuring-related costs and expenses associated with the division consolidation and localization
initiatives, primarily severance and other human resource-related costs.
Net interest expense was $574 million for 2010, compared to $556 million for 2009, an increase of $18 million. The
increase in net interest expense was primarily due to approximately $66 million of expenses associated with the early
retirement of approximately $1,000 million of outstanding debt during 2010, partially offset by lower levels of borrowings due
primarily to such early retirement of outstanding debt.
The Company's effective tax rate of 35.8% for 2010 and 35.2% for 2009 differed from the federal income tax statutory
rate of 35%, and on a comparative basis, principally because of the effect of state and local income taxes and the settlement of
various tax issues and tax examinations. Federal, state and local income tax expense for 2009 included a benefit of
approximately $21 million related to the settlement of federal income tax examinations, primarily attributable to the disposition
of former subsidiaries.
Liquidity and Capital Resources
The Company's principal sources of liquidity are cash from operations, cash on hand and the credit facility described
below.
Net cash provided by operating activities in 2011 was $2,093 million, compared to $1,506 million provided in 2010,