Macy's 2011 Annual Report Download - page 85
Download and view the complete annual report
Please find page 85 of the 2011 Macy's annual report below. You can navigate through the pages in the report by either clicking on the pages listed below, or by using the keyword search tool below to find specific information within the annual report.-
 1
1 -
2
-
3
-
4
-
5
-
6
-
7
-
8
-
9
-
10
-
11
-
12
-
13
-
14
-
15
-
16
-
17
-
18
-
19
-
20
-
21
-
22
-
23
-
24
-
25
-
26
-
27
-
28
-
29
-
30
-
31
-
32
-
33
-
34
-
35
-
36
-
37
-
38
-
39
-
40
-
41
-
42
-
43
-
44
-
45
-
46
-
47
-
48
-
49
-
50
-
51
-
52
-
53
-
54
-
55
-
56
-
57
-
58
-
59
-
60
-
61
-
62
-
63
-
64
-
65
-
66
-
67
-
68
-
69
-
70
-
71
-
72
-
73
-
74
-
 75
75 -
 76
76 -
 77
77 -
 78
78 -
 79
79 -
 80
80 -
 81
81 -
 82
82 -
 83
83 -
 84
84 -
 85
85 -
 86
86 -
 87
87 -
 88
88 -
 89
89 -
 90
90 -
 91
91 -
 92
92 -
 93
93 -
 94
94 -
 95
95 -
96
 |
 |

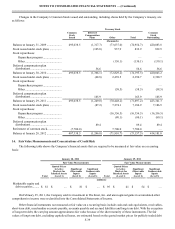
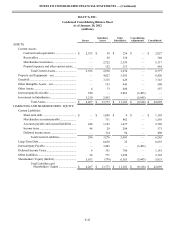
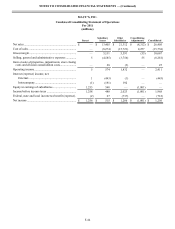
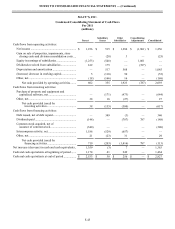
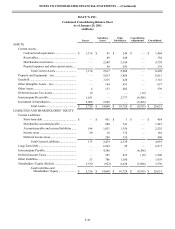
NOTES TO CONSOLIDATED FINANCIAL STATEMENTS — (Continued)
F-45
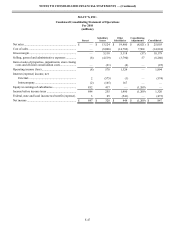
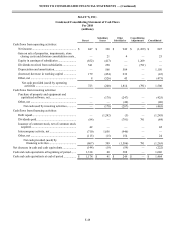
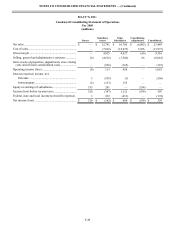
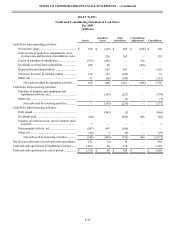
MACY’S, INC.
Condensed Consolidating Statement of Cash Flows
For 2011
(millions)
Parent Subsidiary
Issuer Other
Subsidiaries Consolidating
Adjustments Consolidated
Cash flows from operating activities:
Net income.............................................................. $ 1,256 $ 515 $ 1,286 $ (1,801) $ 1,256
Gain on sale of properties, impairments, store
closing costs and division consolidation costs .... —(28) 3 — (25)
Equity in earnings of subsidiaries........................... (1,253)(548) — 1,801 —
Dividends received from subsidiaries..................... 612 175 — (787) —
Depreciation and amortization................................ — 517 568 — 1,085
(Increase) decrease in working capital.................... 5(110) 50 — (55)
Other, net................................................................. (18)(166) 16 — (168)
Net cash provided by operating activities........ 602 355 1,923 (787) 2,093
Cash flows from investing activities:
Purchase of property and equipment and
capitalized software, net...................................... —(171)(473) — (644)
Other, net................................................................. 38 16 (27) — 27
Net cash provided (used) by
investing activities........................................ 38 (155)(500) — (617)
Cash flows from financing activities:
Debt issued, net of debt repaid................................ — 349 (3) — 346
Dividends paid ........................................................ (148) — (787) 787 (148)
Common stock acquired, net of
issuance of common stock................................... (340) — — — (340)
Intercompany activity, net....................................... 1,186 (529)(657) — —
Other, net................................................................. 21 (23) 31 — 29
Net cash provided (used) by
financing activities ....................................... 719 (203)(1,416) 787 (113)
Net increase (decrease) in cash and cash equivalents.. 1,359 (3) 7 — 1,363
Cash and cash equivalents at beginning of period....... 1,174 41 249 — 1,464
Cash and cash equivalents at end of period ................. $ 2,533 $ 38 $ 256 $ — $ 2,827