Macy's 2011 Annual Report Download - page 18
Download and view the complete annual report
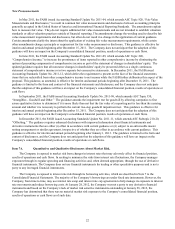
Please find page 18 of the 2011 Macy's annual report below. You can navigate through the pages in the report by either clicking on the pages listed below, or by using the keyword search tool below to find specific information within the annual report.-
 1
1 -
2
-
3
-
4
-
5
-
6
-
7
-
 8
8 -
 9
9 -
 10
10 -
 11
11 -
 12
12 -
 13
13 -
 14
14 -
 15
15 -
 16
16 -
 17
17 -
 18
18 -
 19
19 -
 20
20 -
 21
21 -
 22
22 -
 23
23 -
 24
24 -
 25
25 -
 26
26 -
 27
27 -
 28
28 -
29
-
30
-
31
-
32
-
33
-
34
-
35
-
36
-
37
-
38
-
39
-
40
-
41
-
42
-
43
-
44
-
45
-
46
-
47
-
48
-
49
-
50
-
51
-
52
-
53
-
54
-
55
-
56
-
57
-
58
-
59
-
60
-
61
-
62
-
63
-
64
-
65
-
66
-
67
-
68
-
69
-
70
-
71
-
72
-
73
-
74
-
75
-
76
-
77
-
78
-
79
-
80
-
81
-
82
-
83
-
84
-
85
-
86
-
87
-
88
-
89
-
90
-
91
-
92
-
93
-
94
-
95
-
96
 |
 |

12
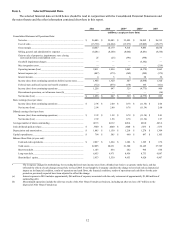
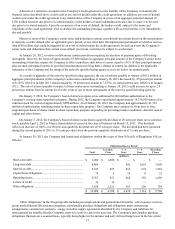
Item 6. Selected Financial Data.
The selected financial data set forth below should be read in conjunction with the Consolidated Financial Statements and
the notes thereto and the other information contained elsewhere in this report.
2011 2010 2009* 2008* 2007
(millions, except per share data)
Consolidated Statement of Operations Data:
Net sales................................................................................................ $ 26,405 $ 25,003 $ 23,489 $ 24,892 $ 26,313
Cost of sales.......................................................................................... (15,738) (14,824) (13,973) (15,009) (15,677)
Gross margin......................................................................................... 10,667 10,179 9,516 9,883 10,636
Selling, general and administrative expenses ....................................... (8,281) (8,260) (8,062) (8,481) (8,554)
Gain on sale of properties, impairments, store closing
costs and division consolidation costs ............................................... 25 (25) (391) (398) —
Goodwill impairment charges............................................................... — — — (5,382) —
May integration costs............................................................................ — — — — (219)
Operating income (loss)........................................................................ 2,411 1,894 1,063 (4,378) 1,863
Interest expense (a) ............................................................................... (447) (579) (562) (588) (579)
Interest income...................................................................................... 4 5 6 28 36
Income (loss) from continuing operations before income taxes........... 1,968 1,320 507 (4,938) 1,320
Federal, state and local income tax benefit (expense) .......................... (712) (473) (178) 163 (411)
Income (loss) from continuing operations............................................ 1,256 847 329 (4,775) 909
Discontinued operations, net of income taxes (b)................................. — — — — (16)
Net income (loss).................................................................................. $ 1,256 $ 847 $ 329 $ (4,775) $ 893
Basic earnings (loss) per share:
Income (loss) from continuing operations............................................ $ 2.96 $ 2.00 $ 0.78 $ (11.34) $ 2.04
Net income (loss).................................................................................. 2.96 2.00 0.78 (11.34) 2.00
Diluted earnings (loss) per share:
Income (loss) from continuing operations............................................ $ 2.92 $ 1.98 $ 0.78 $ (11.34) $ 2.01
Net income (loss).................................................................................. 2.92 1.98 0.78 (11.34) 1.97
Average number of shares outstanding.......................................................... 423.5 422.2 420.4 420.0 445.6
Cash dividends paid per share........................................................................ $ .3500 $ .2000 $ .2000 $ .5275 $ .5175
Depreciation and amortization....................................................................... $ 1,085 $ 1,150 $ 1,210 $ 1,278 $ 1,304
Capital expenditures....................................................................................... $ 764 $ 505 $ 460 $ 897 $ 1,105
Balance Sheet Data (at year end):
Cash and cash equivalents .................................................................... $ 2,827 $ 1,464 $ 1,686 $ 1,385 $ 676
Total assets............................................................................................ 22,095 20,631 21,300 22,145 27,789
Short-term debt ..................................................................................... 1,103 454 242 966 666
Long-term debt...................................................................................... 6,655 6,971 8,456 8,733 9,087
Shareholders’ equity.............................................................................. 5,933 5,530 4,653 4,620 9,907
___________________
* The Company changed its methodology for recording deferred state income taxes from a blended rate basis to a separate entity basis, and has
reflected the effects of such change retroactively to fiscal 2008. Even though the Company considers the change to have had only an immaterial
impact on its financial condition, results of operations and cash flows, the financial condition, results of operations and cash flows for the prior
periods as previously reported have been adjusted to reflect the change.
(a) Interest expense in 2010 includes approximately $66 million of expenses associated with the early retirement of approximately $1,000 million of
outstanding debt.
(b) Discontinued operations include the after-tax results of the After Hours Formalwear business, including an after-tax loss of $7 million on the
disposal of After Hours Formalwear.