Macy's 2011 Annual Report Download - page 79
Download and view the complete annual report
Please find page 79 of the 2011 Macy's annual report below. You can navigate through the pages in the report by either clicking on the pages listed below, or by using the keyword search tool below to find specific information within the annual report.-
 1
1 -
2
-
3
-
4
-
5
-
6
-
7
-
8
-
9
-
10
-
11
-
12
-
13
-
14
-
15
-
16
-
17
-
18
-
19
-
20
-
21
-
22
-
23
-
24
-
25
-
26
-
27
-
28
-
29
-
30
-
31
-
32
-
33
-
34
-
35
-
36
-
37
-
38
-
39
-
40
-
41
-
42
-
43
-
44
-
45
-
46
-
47
-
48
-
49
-
50
-
51
-
52
-
53
-
54
-
55
-
56
-
57
-
58
-
59
-
60
-
61
-
62
-
63
-
64
-
65
-
66
-
67
-
68
-
 69
69 -
 70
70 -
 71
71 -
 72
72 -
 73
73 -
 74
74 -
 75
75 -
 76
76 -
 77
77 -
 78
78 -
 79
79 -
 80
80 -
 81
81 -
 82
82 -
 83
83 -
 84
84 -
 85
85 -
 86
86 -
 87
87 -
 88
88 -
 89
89 -
90
-
91
-
92
-
93
-
94
-
95
-
96
 |
 |

NOTES TO CONSOLIDATED FINANCIAL STATEMENTS — (Continued)
F-39
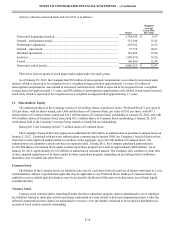
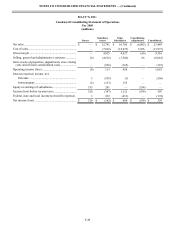
Changes in the Company’s Common Stock issued and outstanding, including shares held by the Company’s treasury, are
as follows:
Treasury Stock
Common
Stock
Issued
Deferred
Compensation
Plans Other Total
Common
Stock
Outstanding
(thousands)
Balance at January 31, 2009 .................... 495,038.5 (1,317.7)(73,637.0)(74,954.7) 420,083.8
Stock issued under stock plans ................ (105.0) 937.9 832.9 832.9
Stock repurchases:
Repurchase program......................... — —
Other ................................................. (130.1)(130.1)(130.1)
Deferred compensation plan
distributions.......................................... 56.6 56.6 56.6
Balance at January 30, 2010 .................... 495,038.5 (1,366.1)(72,829.2)(74,195.3) 420,843.2
Stock issued under stock plans ................ (48.8) 2,439.5 2,390.7 2,390.7
Stock repurchases:
Repurchase program......................... — —
Other ................................................. (58.5)(58.5)(58.5)
Deferred compensation plan
distributions.......................................... 165.9 165.9 165.9
Balance at January 29, 2011 .................... 495,038.5 (1,249.0)(70,448.2)(71,697.2) 423,341.3
Stock issued under stock plans ................ (87.2) 7,274.1 7,186.9 7,186.9
Stock repurchases:
Repurchase program......................... (16,356.5)(16,356.5)(16,356.5)
Other ................................................. (80.1)(80.1)(80.1)
Deferred compensation plan
distributions.......................................... 89.4 89.4 89.4
Retirement of common stock................... (7,700.0) 7,700.0 7,700.0 —
Balance at January 28, 2012 .................... 487,338.5 (1,246.8)(71,910.7)(73,157.5) 414,181.0
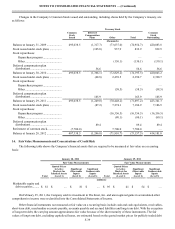
14. Fair Value Measurements and Concentrations of Credit Risk
The following table shows the Company’s financial assets that are required to be measured at fair value on a recurring
basis:
January 28, 2012 January 29, 2011
Fair Value Measurements Fair Value Measurements
Total
Quoted Prices
in Active
Markets for
Identical Assets
(Level 1)
Significant
Observable
Inputs
(Level 2)
Significant
Unobservable
Inputs
(Level 3) Total
Quoted Prices
in Active
Markets for
Identical Assets
(Level 1)
Significant
Observable
Inputs
(Level 2)
Significant
Unobservable
Inputs
(Level 3)
(millions)
Marketable equity and
debt securities......... $ 81 $ — $ 81 $ — $ 95 $ 41 $ 54 $ —
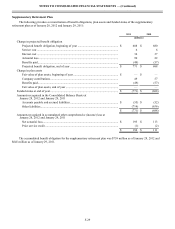
On February 25, 2011, the Company sold its investment in The Knot, Inc. and unrecognized gains in accumulated other
comprehensive income were reclassified into the Consolidated Statements of Income.
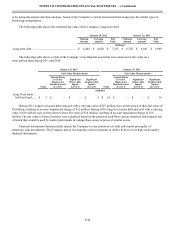
Other financial instruments not measured at fair value on a recurring basis include cash and cash equivalents, receivables,
short-term debt, merchandise accounts payable, accounts payable and accrued liabilities and long-term debt. With the exception
of long-term debt, the carrying amount approximates fair value because of the short maturity of these instruments. The fair
values of long-term debt, excluding capitalized leases, are estimated based on the quoted market prices for publicly traded debt