Macy's 2011 Annual Report Download - page 77
Download and view the complete annual report
Please find page 77 of the 2011 Macy's annual report below. You can navigate through the pages in the report by either clicking on the pages listed below, or by using the keyword search tool below to find specific information within the annual report.-
 1
1 -
2
-
3
-
4
-
5
-
6
-
7
-
8
-
9
-
10
-
11
-
12
-
13
-
14
-
15
-
16
-
17
-
18
-
19
-
20
-
21
-
22
-
23
-
24
-
25
-
26
-
27
-
28
-
29
-
30
-
31
-
32
-
33
-
34
-
35
-
36
-
37
-
38
-
39
-
40
-
41
-
42
-
43
-
44
-
45
-
46
-
47
-
48
-
49
-
50
-
51
-
52
-
53
-
54
-
55
-
56
-
57
-
58
-
59
-
60
-
61
-
62
-
63
-
64
-
65
-
66
-
 67
67 -
 68
68 -
 69
69 -
 70
70 -
 71
71 -
 72
72 -
 73
73 -
 74
74 -
 75
75 -
 76
76 -
 77
77 -
 78
78 -
 79
79 -
 80
80 -
 81
81 -
 82
82 -
 83
83 -
 84
84 -
 85
85 -
 86
86 -
 87
87 -
88
-
89
-
90
-
91
-
92
-
93
-
94
-
95
-
96
 |
 |

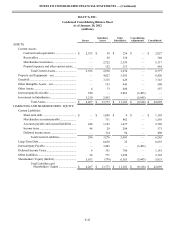
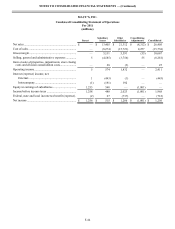
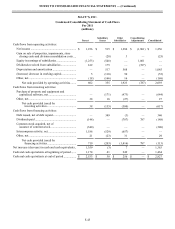
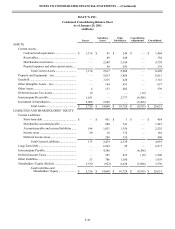
NOTES TO CONSOLIDATED FINANCIAL STATEMENTS — (Continued)
F-37
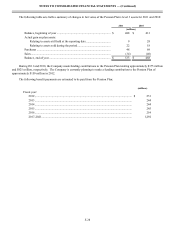
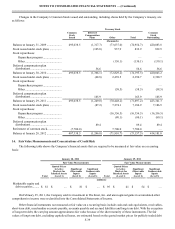
period ending January 30, 2010. There were a total of 1,649,870 stock credit awards outstanding as of January 28, 2012,
relating to the 2008 grant. In general, with respect to the stock credits awarded to participants in 2008, the value of one-half of
the stock credits earned plus reinvested dividend equivalents was paid in cash in early 2012 and the value of the other half of
such earned stock credits plus reinvested dividend equivalents will be paid in cash in early 2013. Compensation expense for
stock credit awards is recorded on a straight-line basis primarily over the vesting period and is calculated based on the ending
stock price for each reporting period. At January 28, 2012 and January 29, 2011, the liability under the stock credit plans, which
is reflected in accounts payable and accrued liabilities and other liabilities on the Consolidated Balance Sheets, was $55 million
and $52 million, respectively.
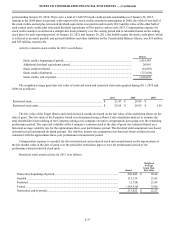
Activity related to stock credits for 2011 is as follows:
Shares
Stock credits, beginning of period............................................................................................. 2,418,345
Additional dividend equivalents earned.................................................................................... 20,961
Stock credits forfeited................................................................................................................ (61,807)
Stock credits distributed ............................................................................................................ (727,629)
Stock credits, end of period....................................................................................................... 1,649,870
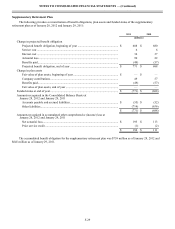
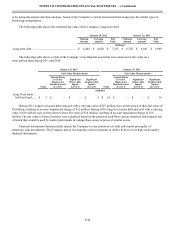
The weighted average grant date fair value of restricted stock and restricted stock units granted during 2011, 2010 and
2009 are as follows:
2011 2010 2009
Restricted stock............................................................................................... $ 23.43 $ 20.89 $ —
Restricted stock units ...................................................................................... $ 23.69 $ 20.95 $ 3.59
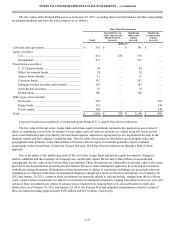
The fair value of the Target Shares and restricted stock awards are based on the fair value of the underlying shares on the
date of grant. The fair value of the Founders Award was determined using a Monte Carlo simulation analysis to estimate the
total shareholder return ranking of the Company among a ten-company executive compensation peer group over the remaining
performance period. The expected volatility of the Company’s common stock at the date of grant was estimated based on a
historical average volatility rate for the approximate three-year performance period. The dividend yield assumption was based
on historical and anticipated dividend payouts. The risk-free interest rate assumption was based on observed interest rates
consistent with the approximate three-year performance measurement period.
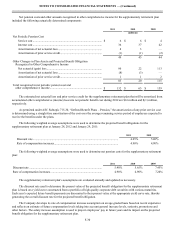
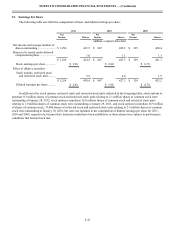
Compensation expense is recorded for all restricted stock and restricted stock unit awards based on the amortization of
the fair market value at the date of grant over the period the restrictions lapse or over the performance period of the
performance-based restricted stock units.
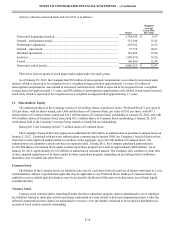
Restricted stock award activity for 2011 is as follows:
Shares
Weighted
Average
Grant Date
Fair Value
Nonvested, beginning of period ...................................................................................... 250,046 $ 28.48
Granted ............................................................................................................................ 115,236 23.43
Forfeited .......................................................................................................................... (5,724) 21.84
Vested.............................................................................................................................. (145,936) 33.90
Nonvested, end of period................................................................................................. 213,622 $ 22.23