Macy's 2011 Annual Report Download - page 44
Download and view the complete annual report
Please find page 44 of the 2011 Macy's annual report below. You can navigate through the pages in the report by either clicking on the pages listed below, or by using the keyword search tool below to find specific information within the annual report.-
 1
1 -
2
-
3
-
4
-
5
-
6
-
7
-
8
-
9
-
10
-
11
-
12
-
13
-
14
-
15
-
16
-
17
-
18
-
19
-
20
-
21
-
22
-
23
-
24
-
25
-
26
-
27
-
28
-
29
-
30
-
31
-
32
-
33
-
 34
34 -
 35
35 -
 36
36 -
 37
37 -
 38
38 -
 39
39 -
 40
40 -
 41
41 -
 42
42 -
 43
43 -
 44
44 -
 45
45 -
 46
46 -
 47
47 -
 48
48 -
 49
49 -
 50
50 -
 51
51 -
 52
52 -
 53
53 -
 54
54 -
55
-
56
-
57
-
58
-
59
-
60
-
61
-
62
-
63
-
64
-
65
-
66
-
67
-
68
-
69
-
70
-
71
-
72
-
73
-
74
-
75
-
76
-
77
-
78
-
79
-
80
-
81
-
82
-
83
-
84
-
85
-
86
-
87
-
88
-
89
-
90
-
91
-
92
-
93
-
94
-
95
-
96
 |
 |

F-4
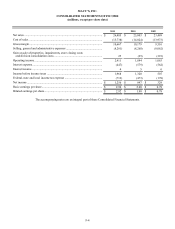
MACY’S, INC.
CONSOLIDATED STATEMENTS OF INCOME
(millions, except per share data)
2011 2010 2009
Net sales.......................................................................................................... $ 26,405 $ 25,003 $ 23,489
Cost of sales .................................................................................................... (15,738)(14,824)(13,973)
Gross margin................................................................................................... 10,667 10,179 9,516
Selling, general and administrative expenses ................................................. (8,281)(8,260)(8,062)
Gain on sale of properties, impairments, store closing costs
and division consolidation costs.................................................................. 25 (25)(391)
Operating income............................................................................................ 2,411 1,894 1,063
Interest expense............................................................................................... (447)(579)(562)
Interest income................................................................................................ 456
Income before income taxes ........................................................................... 1,968 1,320 507
Federal, state and local income tax expense ................................................... (712)(473)(178)
Net income...................................................................................................... $ 1,256 $ 847 $ 329
Basic earnings per share.................................................................................. $ 2.96 $ 2.00 $ 0.78
Diluted earnings per share............................................................................... $ 2.92 $ 1.98 $ 0.78
The accompanying notes are an integral part of these Consolidated Financial Statements.