Macy's 2011 Annual Report Download - page 80
Download and view the complete annual report
Please find page 80 of the 2011 Macy's annual report below. You can navigate through the pages in the report by either clicking on the pages listed below, or by using the keyword search tool below to find specific information within the annual report.-
 1
1 -
2
-
3
-
4
-
5
-
6
-
7
-
8
-
9
-
10
-
11
-
12
-
13
-
14
-
15
-
16
-
17
-
18
-
19
-
20
-
21
-
22
-
23
-
24
-
25
-
26
-
27
-
28
-
29
-
30
-
31
-
32
-
33
-
34
-
35
-
36
-
37
-
38
-
39
-
40
-
41
-
42
-
43
-
44
-
45
-
46
-
47
-
48
-
49
-
50
-
51
-
52
-
53
-
54
-
55
-
56
-
57
-
58
-
59
-
60
-
61
-
62
-
63
-
64
-
65
-
66
-
67
-
68
-
69
-
 70
70 -
 71
71 -
 72
72 -
 73
73 -
 74
74 -
 75
75 -
 76
76 -
 77
77 -
 78
78 -
 79
79 -
 80
80 -
 81
81 -
 82
82 -
 83
83 -
 84
84 -
 85
85 -
 86
86 -
 87
87 -
 88
88 -
 89
89 -
 90
90 -
91
-
92
-
93
-
94
-
95
-
96
 |
 |
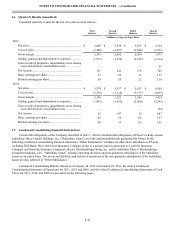
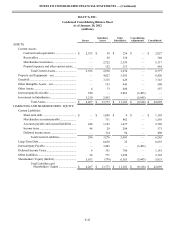
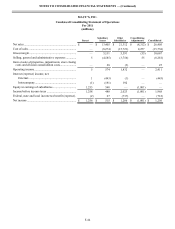
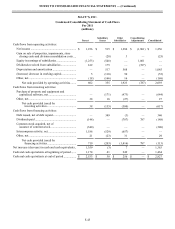
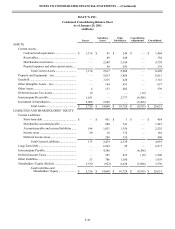
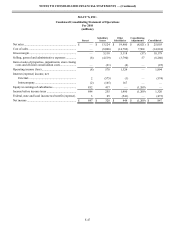
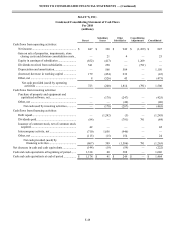
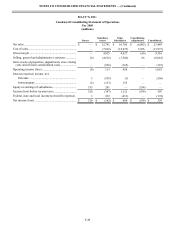
NOTES TO CONSOLIDATED FINANCIAL STATEMENTS — (Continued)
F-40
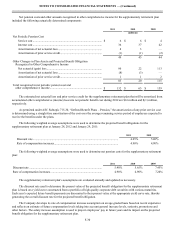
or by using discounted cash flow analyses, based on the Company’s current incremental borrowing rates for similar types of
borrowing arrangements.
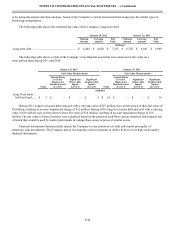
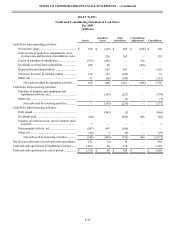
The following table shows the estimated fair value of the Company’s long-term debt:
January 28, 2012 January 29, 2011
Notional
Amount Carrying
Amount Fair
Value Notional
Amount Carrying
Amount Fair
Value
(millions)
Long-term debt............................................................. $ 6,404 $ 6,620 $ 7,343 $ 6,702 $ 6,941 $ 6,969
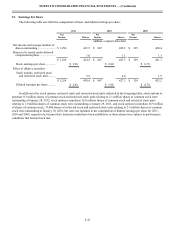
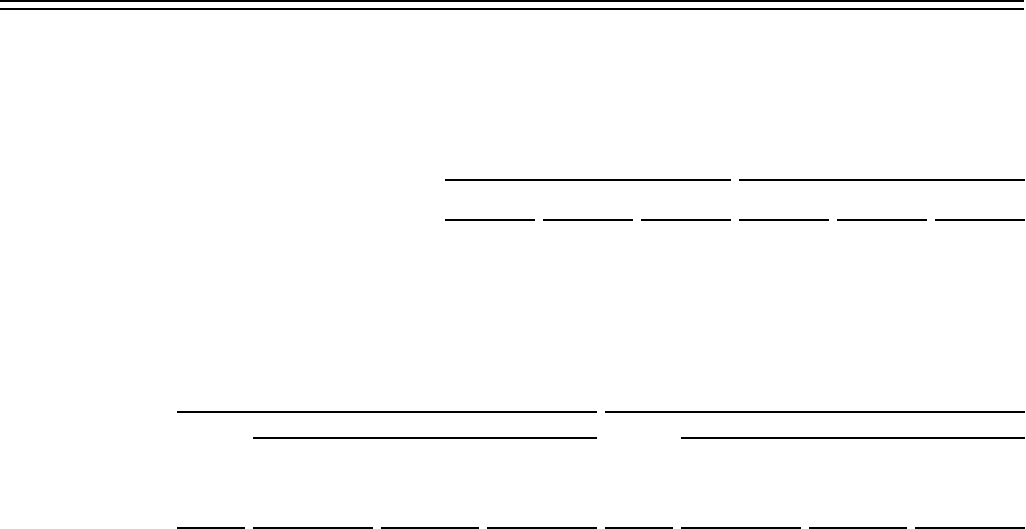
The following table shows certain of the Company’s non-financial assets that were measured at fair value on a
nonrecurring basis during 2011 and 2010:
January 28, 2012 January 29, 2011
Fair Value Measurements Fair Value Measurements
Total
Quoted Prices
in Active
Markets for
Identical Assets
(Level 1)
Significant
Observable
Inputs
(Level 2)
Significant
Unobservable
Inputs
(Level 3) Total
Quoted Prices
in Active
Markets for
Identical Assets
(Level 1)
Significant
Observable
Inputs
(Level 2)
Significant
Unobservable
Inputs
(Level 3)
(millions)
Long-lived assets
held and used....... $ 5 $ — $ — $ 5 $ 18 $ — $ — $ 18
During 2011, long-lived assets held and used with a carrying value of $27 million were written down to their fair value of
$5 million, resulting in an asset impairment charge of $22 million. During 2010, long-lived assets held and used with a carrying
value of $36 million were written down to their fair value of $18 million, resulting in an asset impairment charge of $18
million. The fair values of these locations were calculated based on the projected cash flows and an estimated risk-adjusted rate
of return that would be used by market participants in valuing these assets or prices of similar assets.
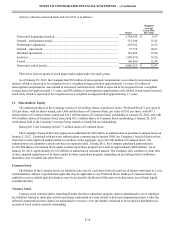
Financial instruments that potentially subject the Company to concentrations of credit risk consist principally of
temporary cash investments. The Company places its temporary cash investments in what it believes to be high credit quality
financial instruments.