Lumber Liquidators 2007 Annual Report Download - page 65
Download and view the complete annual report
Please find page 65 of the 2007 Lumber Liquidators annual report below. You can navigate through the pages in the report by either clicking on the pages listed below, or by using the keyword search tool below to find specific information within the annual report.-
 1
1 -
2
-
3
-
4
-
5
-
6
-
7
-
8
-
9
-
10
-
11
-
12
-
13
-
14
-
15
-
16
-
17
-
18
-
19
-
20
-
21
-
22
-
23
-
24
-
25
-
26
-
27
-
28
-
29
-
30
-
31
-
32
-
33
-
34
-
35
-
36
-
37
-
38
-
39
-
40
-
41
-
42
-
43
-
44
-
45
-
46
-
47
-
48
-
49
-
50
-
51
-
52
-
53
-
54
-
 55
55 -
 56
56 -
 57
57 -
 58
58 -
 59
59 -
 60
60 -
 61
61 -
 62
62 -
 63
63 -
 64
64 -
 65
65 -
 66
66 -
 67
67 -
 68
68 -
 69
69 -
 70
70 -
 71
71 -
 72
72 -
 73
73 -
 74
74 -
 75
75 -
76
-
77
-
78
-
79
-
80
 |
 |

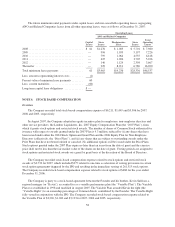
In addition, the Company maintains a stock unit plan for regional store management, the 2006 Stock Unit
Plan for Regional Managers (the “2006 Regional Plan”). In May 2006, certain Regional Managers were granted a
total of 85,000 stock units that vest over approximately a five year period. The Founder will contribute 85,000
shares of Common Stock necessary to provide for the exercise of the stock units. No additional grants of stock
units are available under the 2006 Regional Plan. The stock units would have expired without value unless a
trigger event, as defined, occurred. The IPO was a trigger event, and the Company recorded $258 of stock-based
compensation expense in the fourth quarter of 2007. The remaining $387 of stock compensation expense will be
recognized over the next 3 years.
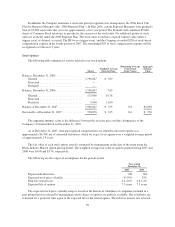
Stock Options
The following table summarizes activity related to our stock options:
Shares
Weighted Average
Exercise Price
Remaining Average
Contractual
Term (Years)
Aggregate
Intrinsic
Value
Balance, December 31, 2005 .................. —
Granted ............................... 1,796,847 $ 7.69
Exercised .............................. —
Forfeited .............................. —
Balance, December 31, 2006 .................. 1,796,847 7.69
Granted ............................... 175,000 10.78
Exercised .............................. —
Forfeited .............................. 5,000 11.00
Balance at December 31, 2007 ................. 1,966,847 $ 7.95 8.8 $2,038
Exercisable at December 31, 2007 .............. 708,876 $ 7.65 8.6 $ 950
The aggregate intrinsic value is the difference between the exercise price and the closing price of the
Company’s Common Stock on December 31, 2007.
As of December 31, 2007, total unrecognized compensation cost related to unvested options was
approximately $4,708, net of estimated forfeitures, which we expect to recognize over a weighted average period
of approximately 2.4 years.
The fair value of each stock option award is estimated by management on the date of the grant using the
Black-Scholes-Merton option pricing model. The weighted average fair value of options granted during 2007 and
2006 were $4.08 and $3.74, respectively.
The following are the ranges of assumptions for the periods noted:
Year ended
December 31,
2007 2006
Expected dividend rate ............................................ Nil Nil
Expected stock price volatility ...................................... 35-39% 35%
Risk-free interest rate ............................................. 4.2-4.6% 4.6-5.2%
Expected life of options ........................................... 7.5years 7.5 years
The expected stock price volatility range is based on the historical volatilities of companies included in a
peer group that was selected by management whose shares or options are publicly available. The volatilities are
estimated for a period of time equal to the expected life of the related option. The risk-free interest rate is based
59