Lumber Liquidators 2007 Annual Report Download - page 41
Download and view the complete annual report
Please find page 41 of the 2007 Lumber Liquidators annual report below. You can navigate through the pages in the report by either clicking on the pages listed below, or by using the keyword search tool below to find specific information within the annual report.-
 1
1 -
2
-
3
-
4
-
5
-
6
-
7
-
8
-
9
-
10
-
11
-
12
-
13
-
14
-
15
-
16
-
17
-
18
-
19
-
20
-
21
-
22
-
23
-
24
-
25
-
26
-
27
-
28
-
29
-
30
-
 31
31 -
 32
32 -
 33
33 -
 34
34 -
 35
35 -
 36
36 -
 37
37 -
 38
38 -
 39
39 -
 40
40 -
 41
41 -
 42
42 -
 43
43 -
 44
44 -
 45
45 -
 46
46 -
 47
47 -
 48
48 -
 49
49 -
 50
50 -
 51
51 -
52
-
53
-
54
-
55
-
56
-
57
-
58
-
59
-
60
-
61
-
62
-
63
-
64
-
65
-
66
-
67
-
68
-
69
-
70
-
71
-
72
-
73
-
74
-
75
-
76
-
77
-
78
-
79
-
80
 |
 |

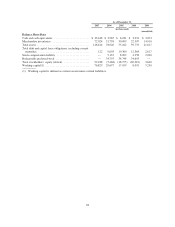
Results of Operations
The following tables set forth components of our results of operations for the periods indicated, both in
dollars and as a percentage of net sales.
Year Ended December 31,
2007 2006 2005
(in millions, except percentages
and number of stores)
Net sales ....................................................... $405.3 $332.1 $244.9
Comparable store net sales increase from prior year .................. 8.6% 17.3% 19.0%
Number of stores opened in period(1) .............................. 25 16 19
Cost of sales .................................................... 270.2 221.9 158.8
Gross profit ..................................................... 135.1 110.1 86.1
SG&A expenses ................................................. 116.3 88.7 67.9
Operating income ................................................ 18.8 21.4 18.2
Net income ..................................................... 11.3 12.9 10.7
Year Ended December 31,
2007 2006 2005
(% of net sales)
Net sales ....................................................... 100.0% 100.0% 100.0%
Cost of sales .................................................... 66.7% 66.8% 64.8%
Gross profit ..................................................... 33.3% 33.2% 35.2%
SG&A expenses ................................................. 28.7% 26.7% 27.7%
Operating income ................................................ 4.6% 6.4% 7.4%
Net income ..................................................... 2.8% 3.9% 4.4%
(1) In May 2006, we closed a laminate flooring-only store that had been established to operate during the
remaining lease period of a relocated store.
Year Ended December 31, 2007 Compared to Year Ended December 31, 2006
Net Sales. Net sales increased approximately $73.2 million, or 22.1%, to $405.3 million in 2007 from
$332.1 million in 2006. This increase was primarily driven by an increase of $44.7 million in non-comparable
store net sales, including $19.5 million at the 25 stores opened in 2007, and an increase of $28.5 million, or 8.6%,
in comparable store net sales. Generally strong consumer demand for our expanded product assortment continued
to drive comparable store increases in sales volume, primarily measured in square footage, and changes in our
sales mix which increased our average retail price per unit sold approximately 3.3%. Overall net sales increased
due principally to the following factors:
• In 2007, increased demand was driven in part by strength in the sales of the Bellawood line,
particularly exotic hardwoods, and the broader assortment of engineered hardwoods, including an
expanded offering of handscraped products, which offset declines in sales of liquidation deals and
unfinished hardwoods.
• Moldings and accessories increased 41% and represented 10% of net sales in 2007, up from 8% of net
sales in 2006 as we broadened our assortment and committed to a more consistent in-stock position.
• Increases in comparable store net sales were driven primarily by the continued maturation of stores in
operation for 13 to 36 months at December 31, 2007, where comparable net sales increased $20.5
million, or 26.2%. Net sales at these comparable stores generally increase faster than at our mature
stores.
Gross Profit and Gross Margin. Gross profit increased approximately $25.0 million, or 22.7%, to $135.1
million in 2007 from $110.1 million for 2006, and gross margin increased to 33.3% from 33.2%. In 2007, gross
35